Chart templates solve the old problem of having to send out copy-and-paste samples of graphs. But they only display the first 6 of the chart template colors you designed.
Adding More Colors
The most common application of chart templates is to overcome the design limitation of having only a 6-color palette to work with. I wrote about this problem years ago: Office Charts: 6 Colors Maximum! – Best Practices. After a chart uses Accents 1 to 6, it starts recycling those same 6 colors with automatically generated darker and lighter variations. Banks and wealth management clients often need many more than 6 data series in their charts, but still want to have colors that are on-brand and designed.
To create a wider range of data series colors, create a chart with the maximum number of data series that the client requires. Our record is 25 colors! Then right-click on the chart edge and choose Save as Template. This captures the formatting of the sample that you’ve created.
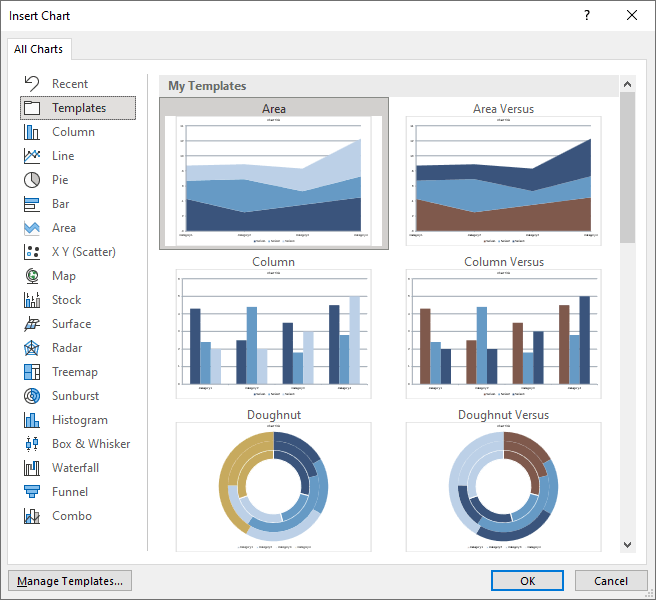
Your template will work just fine on charts that have already been created. Select the chart, choose Change Chart Type (yes, even if it’s the right type already), click on the Templates icon, select the chart template and click on Apply. Easy peasy, job done!
The New Chart Problem
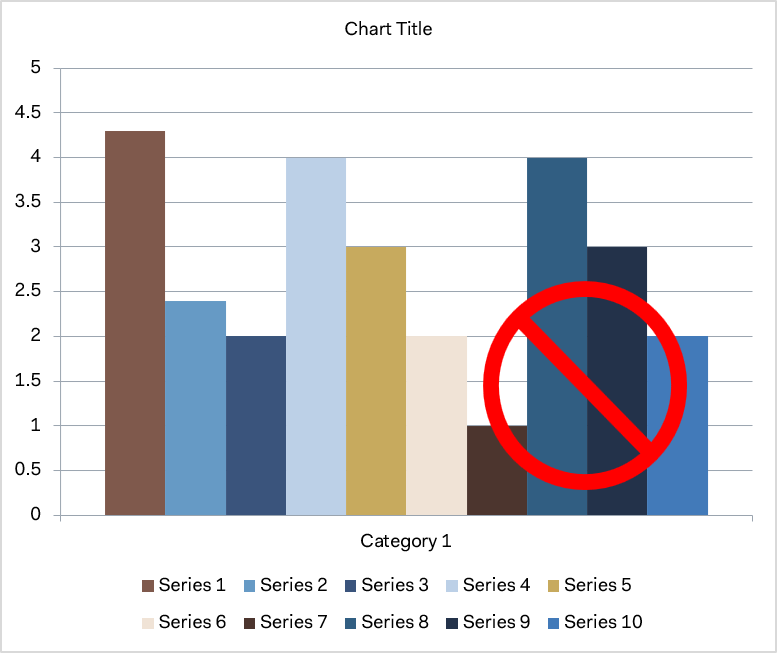
But this process breaks down if you try to create a new chart from that template. Choose Insert>Chart, click on Templates, and select the chart type. Then start inputting data. As soon as you get past the 6th color, Office starts using those damn Microsoft default darker and lighter variations instead of the colors you set! This is Authoritarian Helpfulness at its worst!
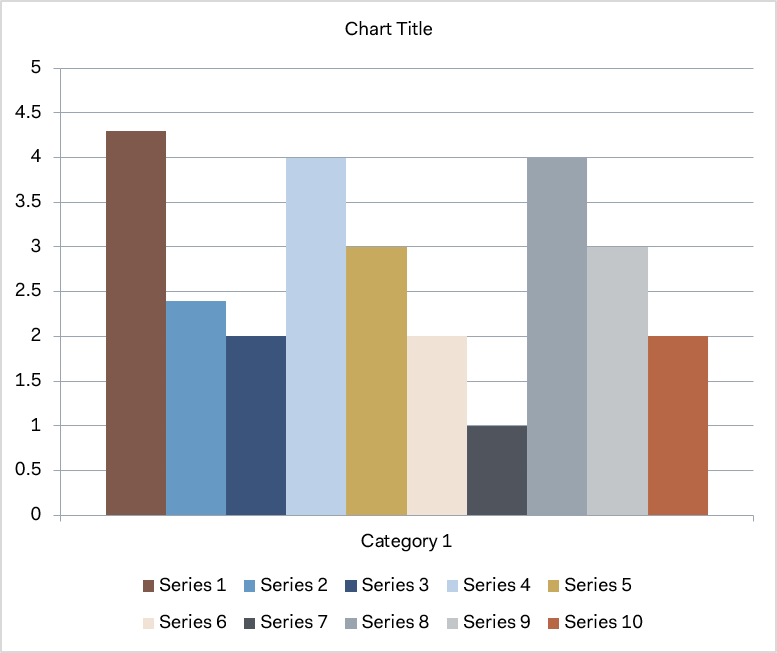
What You DesignedWhat Office Gives You
Yes, you can fix this. Reapply the template by choosing Change Chart Type>Templates and reselecting the template. The colors are corrected to the design specs. But you shouldn’t have to do this! And now that you’ve found this article, you don’t have to.
Understanding Chart Template Colors
Let me back up a bit, and explain how chart templates are structured. The top level of the XML consists of [Content_Types].xml, a _rels folder for documenting the relationships of XML parts and a chart folder holding the good bits.
Inside the chart folder, we find chart.xml, which holds most of the formatting that we created when we made the custom chart. Chart.xml contains definitions that contain the intended series color. The colors in chart.xml get set when you save the file as a chart template, and they get used when you apply the template to an existing table. But they are not used when you create a new chart.
Each series is numbered starting with 0, so this is the series for the 7th color. For the first six, the color is set to an accent color. Starting with the 7th, the color fills are in RGB/hexadecimal. Here’s a sample:
In addition, there are subfolders for charts, media, theme, and _rels. The media folder only holds a BMP file that is used for thumbnail display in Office 2007 and 2010, but not in later versions. The _rels folder is for relationships of XML parts. The theme folder contains themeOverride1.xml. As the name suggests, this is a theme that overrides the theme of an Office file that hosts it. This allows you to use a chart template in any Office document while retaining the original design appearance. Finally, we have the charts folder, which has the XML part we’re looking for.
This folder contains 2 files: style1.xml, containing the formatting for all the chart parts and colors1.xml, with a list of default fill colors and transforms fo apply to those colors. Colors1.xml is the file that supplies the colors when a new chart is created from the template. Here’s what colors1.xml looks like:
On a newly inserted chart, an Office program will use the 6 colors in turn. Then it will cycle through them again, applying the a:lumMod val=”60000″ transform. LumMod modifies the luminance, turning each accent color to a dark version. The chart will follow this pattern instead of using the colors you designed for the extra data series. If you reapply the chart type to the chart, then it will update with your designed colors from chart.xml
Fixing Chart Template Colors
My first step was to read the Microsoft specs for cs:colorStyle. Under section 2.8.3.2 CT_ColorStyle, it reads: “The total set of colors is all contained colors repeated each time with each variation applied. A color style can contain 6 colors and 7 variations. This yields a total of 42 colors with the first 6 having the first variation applied, the second 6 having the second variation applied and so on.” Not promising, we really need more than 6 colors here.
After many fruitless experiments, I decided to see if I could add extra colors anyway:
To my astonishment, it worked! I could create a new chart and insert 10 dataseries with each displaying the designed color. No need to reapply the template! Who would ever have dreamt that Microsoft documentation has a mistake in it! ;-D
The takeaway is that to create a many-colored chart template that works as expected under all circumstances, you need to set the extra color values manually in colors1.xml.
5:05 pm
11 thoughts on “OOXML Hacking – Chart Template Colors”
This is so awesome, John, and will help so many users. Thank you for sharing.
Thank you for sharing, I will be sure to check this out as I’m trying to figure out how to make charts with 20 predetermined colors. Can you show an example of code where you used 10 colors? I’m not sure I’m seeing/understanding how you added the extra colors in the example code you have up.
As a related question, do you know if there is a way to set the default font sizes in charts (axiis and data labels)? Thanks as always!
Is my understanding correct that there’s no way to change a chart’s format (i.e., no gridlines, axis line weight, legend position, etc.) within .xml? I do see that the colors can be changed. But specifically changing the design of the built-in PowerPoint charts (without resorting to the dedicated “Templates” folder. I hope this question makes sense 🙂
The Microsoft charts do not exist as separate editable file until they are inserted in a presentation. There is no way to intercept Microsoft’s programming to create different versions of the default charts. Microsoft invented chart templates to get around this problem. The only alternative is to use the old-fashioned technique of including sample charts that a user must copy and paste.
Unfortunately this didn’t seem to work for me when I edited colors1.xml. It seems relatively straight forward, but I not sure why when I insert a chart template it doesn’t seem to be used. My issue is complicated a bit by the fact that I was asked to keep the 6 accent colors in varying shades of blue. BUT only offer custom colors to be used in charts (colors that are easier to distinguish). I tried creating a .crtx file by defining the colors I want. It seems that PowerPoint will only honor 3 colors. Even though the first custom colors are inserted correctly, any series after it is not the color I want to appear. In theory, my custom colors would be in the .xml file you provided, overriding the 6 accent colors (plus few more). Is there anything I’m overlooking here. My unzipped file has files named colors1.xml through colors20.xml
The article does not suggest creating extra color files beyond colors1.xml. Instead, all colors should be added to the colors1.xml part, as shown in the Fixing Chart Template Colors section of the article.
When creating a sample chart that will be the source of a chart template, the sample chart should be formatted with the maximum number of data series that the client requires. Then save it as a template. This saves the sample series formatting to the chart.xml part. Then edit the saved chart template, editing colors1.xml to add the colors that are to be used for each data series.
Do the first six colours have to remain accent colours in colors1.xml? Does a tmplate chart have to be created first for these new colour definitions to take effect?
The colors, including the first 6, can be any color, not necessarily the theme colors. You’ll find that when a new Microsoft chart is inserted, it will automatically use the theme colors. Edit these colors to your preferred colors, then save the chart as a template. When a new chart is created from that template, it will use your colors instead of the theme colors of the host file.
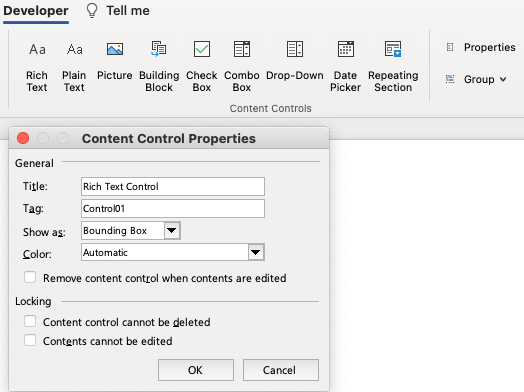
Subscribe to the Best Practices blog and get a free copy of our new Control Control add-in. This is the easiest way to create the same modern form controls that are in Word for Windows. Enter your real email and hit Subscribe in the right-hand column of this page. You’ll receive the add-in and installation instructions within 3 days.

This is so awesome, John, and will help so many users. Thank you for sharing.
Thank you for sharing, I will be sure to check this out as I’m trying to figure out how to make charts with 20 predetermined colors. Can you show an example of code where you used 10 colors? I’m not sure I’m seeing/understanding how you added the extra colors in the example code you have up.
As a related question, do you know if there is a way to set the default font sizes in charts (axiis and data labels)? Thanks as always!
The article above shows how I modified the XML to add more than the 6 basic colors.
Set the font size in the sample chart, then save it as a template. The template will retain the font settings.
after I do that, is there a place in the XML for me to grab it if I want to apply it to other files?
If you open the new chart template and compare it to the old templates, you can find the locations for font information. Or we can do it for you.
Is my understanding correct that there’s no way to change a chart’s format (i.e., no gridlines, axis line weight, legend position, etc.) within .xml? I do see that the colors can be changed. But specifically changing the design of the built-in PowerPoint charts (without resorting to the dedicated “Templates” folder. I hope this question makes sense 🙂
The Microsoft charts do not exist as separate editable file until they are inserted in a presentation. There is no way to intercept Microsoft’s programming to create different versions of the default charts. Microsoft invented chart templates to get around this problem. The only alternative is to use the old-fashioned technique of including sample charts that a user must copy and paste.
Unfortunately this didn’t seem to work for me when I edited colors1.xml. It seems relatively straight forward, but I not sure why when I insert a chart template it doesn’t seem to be used. My issue is complicated a bit by the fact that I was asked to keep the 6 accent colors in varying shades of blue. BUT only offer custom colors to be used in charts (colors that are easier to distinguish). I tried creating a .crtx file by defining the colors I want. It seems that PowerPoint will only honor 3 colors. Even though the first custom colors are inserted correctly, any series after it is not the color I want to appear. In theory, my custom colors would be in the .xml file you provided, overriding the 6 accent colors (plus few more). Is there anything I’m overlooking here. My unzipped file has files named colors1.xml through colors20.xml
The article does not suggest creating extra color files beyond colors1.xml. Instead, all colors should be added to the colors1.xml part, as shown in the Fixing Chart Template Colors section of the article.
When creating a sample chart that will be the source of a chart template, the sample chart should be formatted with the maximum number of data series that the client requires. Then save it as a template. This saves the sample series formatting to the chart.xml part. Then edit the saved chart template, editing colors1.xml to add the colors that are to be used for each data series.
Do the first six colours have to remain accent colours in colors1.xml? Does a tmplate chart have to be created first for these new colour definitions to take effect?
The colors, including the first 6, can be any color, not necessarily the theme colors. You’ll find that when a new Microsoft chart is inserted, it will automatically use the theme colors. Edit these colors to your preferred colors, then save the chart as a template. When a new chart is created from that template, it will use your colors instead of the theme colors of the host file.