Office has the abilty to insert 3D models and to create 3D shapes. Both of these using lighting, but the Office interface does not include any lighting controls. To change 3D lighting, you have to hack the XML.
There is very little documentation online for 3D lighting in OOXML aside from the Microsoft pages at 2.31 http://schemas.microsoft.com/office/drawing/2017/model3d. The am3d element that represents 3D models does not appear in the older ECMA-376 reference that defines the Office file formats. ECMA 376 has been superceded by ISO/IEC 29500-1:2016.
When a 3D model is inserted in an Office document, the model file is storeed in the media subfolder, along with a PNG rendering of the view of the model when the document was saved. The PNG is displayed when the document is re-opened and serves as a fallback image when the file is viewed in an earlier version of Office that doesn’t support 3D models.
The rendering information for the model is stored in the document, not in the embedded model file. In Word, the rendering information is stored in word/document.xml. In PowerPoint, it is kept in ppt/slides/slideX.xml, where X is the slide index number. In Excel, look xl/drawings/drawingX.xml.
3D models use scrgbClr parameters for lighting color with numbers expressed in a percentage. But unlike scrgbClr elsewhere in Office, the syntax is not r=”50%” g=”50%” b=”50%”. Instead, use whole numbers with three zeros added, so 50% becomes 50000: <a:scrgbClr r=”50000″ g=”50000″ b=”50000″/>
Here is a typical lighting section for a 3D model or shape:
The first section is am3d:ambientLight that controls the ambient (background directionless) light. Set the color with am3d:clr and the intensity with am3d:illuminance. The illuminance n and d parameters represent the numerator and denominator of a ratio. So the default values of n=”500000″ d=”1000000″ are equivalent to 1/2 or 50% brightness.
After that, the are three point lights (am3d:ptLight). You don’t have to use all three. You can delete them from the XML, comment them out or use the enabled parameter to turn them off:
<am3d:ptLight rad="0" enabled="false">
The rad parameter sets the radius of the light. The units are EMUs (English Metric Units), where 1 inch has 914,400 EMUs and 1 centimeter equals 360,000 EMUs. Set this number in the millions to have a noticeable effect.
You can also add more point lights, but usually three is enough. The color and intensity parameters work the same way as the ambient light.
The other major parameters are for the position of the lights. The left-right position is set by the x number. 0 is dead center, positive numbers move the light to the right and negative numbers to the left. The y number controls the position up and down, while z controls the in-out third dimension. This line would place the light inside the model:
<am3d:pos x="0" y="0" z="0"/>
The pos units are also EMUs. Use tens of millions to notice the effect.
After making changes to the XML and re-opening the presentation with the model, the appearance will be the same as before you edited it. This is because PowerPoint displays a PNG of the model, created when you save. To display the revised lighting, you must make a small change to the model so PowerPoint updates the appearance.
Years ago, Ken Puls of the excellent Excelguru site published an Excel add-in that displays the icons built into Excel. This reference is useful for any programmer wanting to repurpose built-in icons to use with their own code. Here’s where you can download the original: Office 2007 Icon Gallery. His version has gradually become outdated as Microsoft has added more icons to the software, and there was no version for PowerPoint. The latter isn’t such a big deal, because Excel, Word and PowerPoint share a common library of icons.
With Ken’s gracious permission, I’ve created an updated PowerPoint version of this add-in. This displays all the icons in current versions of Office, and it runs under PowerPoint for Windows and for Mac.
This is version 2. If you downloaded this prior to January 24, 2023, please download and install this improved version. I haven’t created an installer for this, but here are the instructions for manual installation:
The download is a zip file that holds a single Icon Gallery.ppam file. Expand the zip and copy the .ppam file to your desktop or other easy-to-find location. Here’s how to make it appear in PowerPoint for Windows:
In PowerPoint, choose File>Options>Add-ins.
Change the Manage dropdown to PowerPoint Add-ins, then click on the Go button. The Add-ins dialog opens.
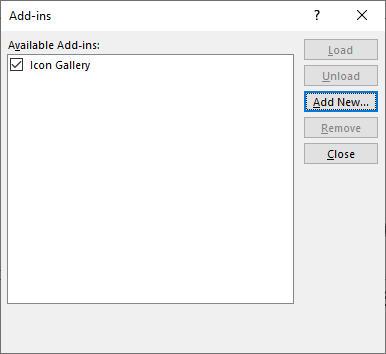
Click on the Add New button. Navigate to the location where you saved the .ppam file, select it and click on OK. The Add-ins dialog should look like this, displaying the add-in name with a check mark beside it:
Click on the Close button.
In PowerPoint, select the View tab. At the right end, you should see a new group called Office Icons:
macOS Installation
In PowerPoint, choose Tools>PowerPoint Add-ins from the macOS menu bar. The Add-ins dialog opens.
Click on the Plus (+) sign. Navigate to the location where you saved the .ppam file, select it and click on OK.
PowerPoint will pop up a macro warning. Click on the Enable Macros button.
Then PowerPoint will pop up this dialog, astoundingly badly worded, even for Microsoft: It sounds like you’re turning off macro protection completely, right? Well you’re not. This just turns it off for this file, and it has no effect on the macro virus protection settings, so there’s nothing to even turn on again! Click on Turn Off.
The Add-ins dialog should look like this, displaying the add-in name with a check mark beside it:
Click on the OK button.
In PowerPoint, select the View tab. At the right end, you should see a new group called Office Icons:
Using the PowerPoint Icon Gallery
Windows Useage
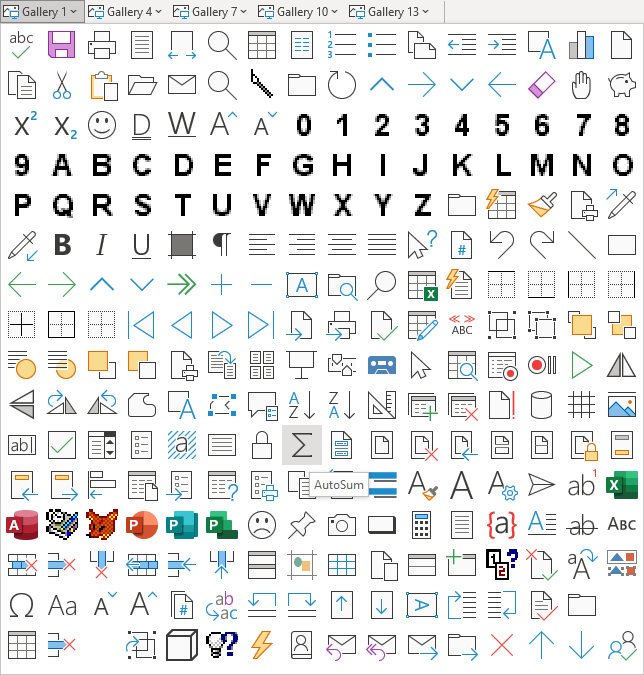
Click on one of the galleries to see a group of icons. Here are the first 256:
Hover over an icon to see its idMso command name.
Click on an icon to open a dialog that shows the command name for use with idMso or imageMso commands. Click on the Copy to Clipboard button to copy the command name. Then paste the name into your XML or other code. Due to a bug in File Explorer, all Explorer windows must be closed for this to work as expected.
macOS Useage
Click on one of the galleries to see a group of icons: Note the grey spinning icons: Those are objects that exist in the Windows version, but not in macOS. One of the drawbacks of trying to develop for both platforms is that Microsoft has only done half the job in Office for Mac. Avoid these icons for cross-platform macros.
Hover over an icon to see its idMso command name.
Click on an icon to open a dialog that shows the command name for use with idMso or imageMso commands. Click on the Copy to Clipboard button to copy the command name. Then paste the name into your XML or other code.
Uninstalling the PowerPoint Icon Gallery
Windows Uninstall
In PowerPoint, choose File>Options>Add-ins.
Change the Manage dropdown to PowerPoint Add-ins, then click on Go.
Select the add-in, then click on the Remove button. Close the dialog. The icon gallery disappears from the View tab.
macOS Uninstall
In PowerPoint, choose Tools>PowerPoint Add-ins (on the macOS menu bar).
Select the add-in, then click on the Minus sign (-). Close the dialog. The icon gallery disappears from the View tab.
Notes
Wouldn’t it make more sense to have this on the Developer tab? Well, yes, it would, that’s where the Icon Gallery appears in Ken Puls’ original add-in. But I made one file to work on both Windows and macOS. PowerPoint for macOS is missing the Developer tab. So I put this on the View tab as a second-best location.
Why no icon preview, as in Ken’s original add-in? Previewing icons in VBA relies on the CommandBars.GetImageMso command. This has been deprecated and in recent versions of Office, does not deliver an accurate icon preview. The command is not available at all on Macs, so I removed the preview. But you can see the 32 x 32 version of the icon in the gallery dropdown, not much has been lost.
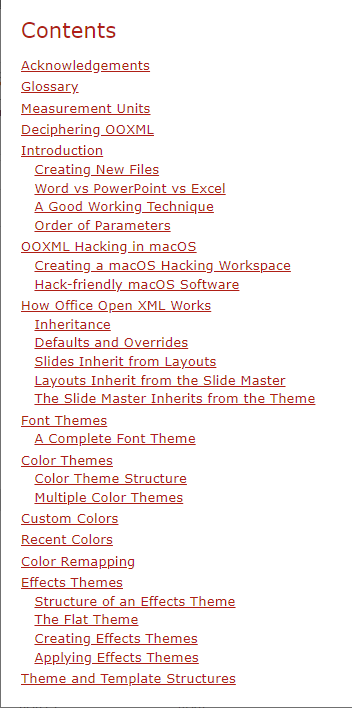
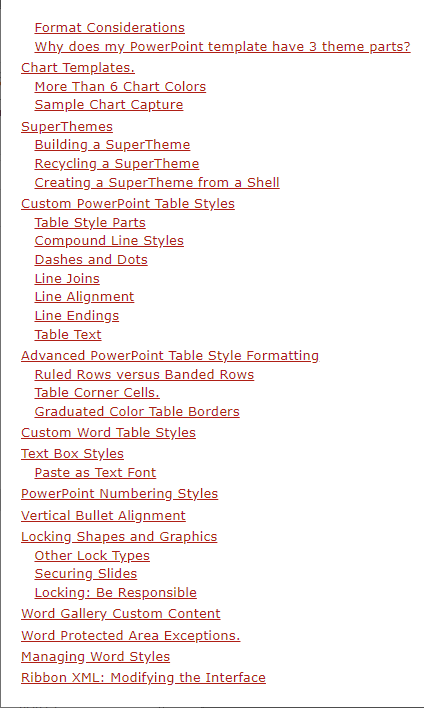
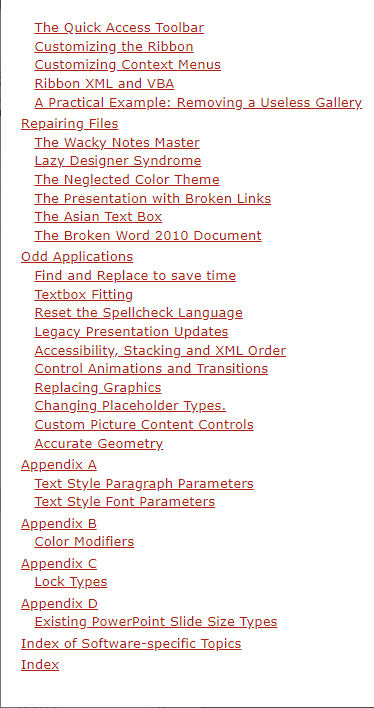
The ebook version of OOXML Hacking has been released. The last three years have gone into adding the equivalent of 40 pages of new information. This is in addition to the trove of unique techniques that already appeared in the print version. Here are screen shots of the table of contents, to give you an idea of the topics covered in this publication:
Barnes & Noble distributes only in the U.S., so use Kobo.com if you’re from another country.
As always, all techniques are covered in both Windows and Mac, where possible. The book contains a link to a downloadable text file of all listings in the book, so you don’t have to re-key text from the screen. The book is currently available on Kobo.com and Barnes & Noble. Barnes & Noble distributes only in the U.S., so use Kobo.com if you’re from another country.
Please note, this e-book has digital rights management applied. All code listings are available in a downloadable text file, so you don’t have to re-key anything. If you have any problems, please contact us at this address
Chart templates solve the old problem of having to send out copy-and-paste samples of graphs. But they only display the first 6 of the chart template colors you designed.
Adding More Colors
The most common application of chart templates is to overcome the design limitation of having only a 6-color palette to work with. I wrote about this problem years ago: Office Charts: 6 Colors Maximum! – Best Practices. After a chart uses Accents 1 to 6, it starts recycling those same 6 colors with automatically generated darker and lighter variations. Banks and wealth management clients often need many more than 6 data series in their charts, but still want to have colors that are on-brand and designed.
To create a wider range of data series colors, create a chart with the maximum number of data series that the client requires. Our record is 25 colors! Then right-click on the chart edge and choose Save as Template. This captures the formatting of the sample that you’ve created.
Your template will work just fine on charts that have already been created. Select the chart, choose Change Chart Type (yes, even if it’s the right type already), click on the Templates icon, select the chart template and click on Apply. Easy peasy, job done!
The New Chart Problem
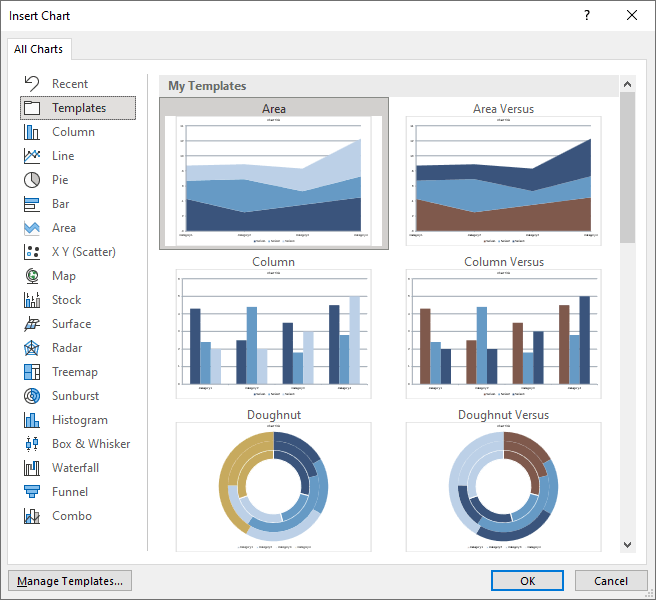
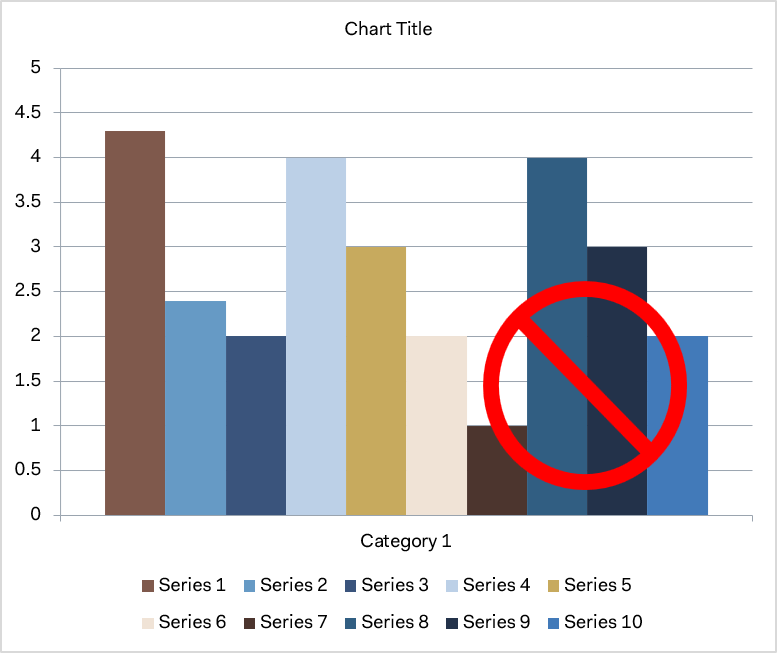
But this process breaks down if you try to create a new chart from that template. Choose Insert>Chart, click on Templates, and select the chart type. Then start inputting data. As soon as you get past the 6th color, Office starts using those damn Microsoft default darker and lighter variations instead of the colors you set! This is Authoritarian Helpfulness at its worst!
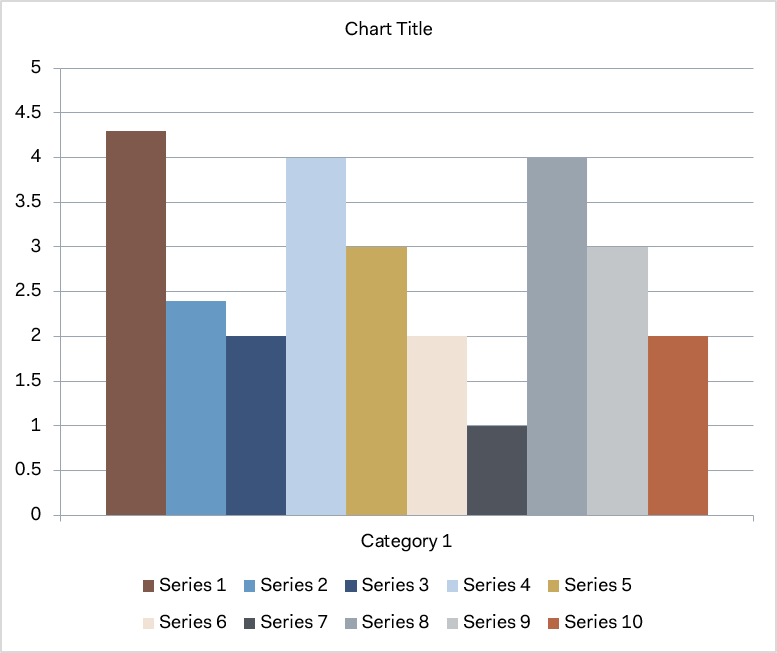
What You DesignedWhat Office Gives You
Yes, you can fix this. Reapply the template by choosing Change Chart Type>Templates and reselecting the template. The colors are corrected to the design specs. But you shouldn’t have to do this! And now that you’ve found this article, you don’t have to.
Understanding Chart Template Colors
Let me back up a bit, and explain how chart templates are structured. The top level of the XML consists of [Content_Types].xml, a _rels folder for documenting the relationships of XML parts and a chart folder holding the good bits.
Inside the chart folder, we find chart.xml, which holds most of the formatting that we created when we made the custom chart. Chart.xml contains definitions that contain the intended series color. The colors in chart.xml get set when you save the file as a chart template, and they get used when you apply the template to an existing table. But they are not used when you create a new chart.
Each series is numbered starting with 0, so this is the series for the 7th color. For the first six, the color is set to an accent color. Starting with the 7th, the color fills are in RGB/hexadecimal. Here’s a sample:
In addition, there are subfolders for charts, media, theme, and _rels. The media folder only holds a BMP file that is used for thumbnail display in Office 2007 and 2010, but not in later versions. The _rels folder is for relationships of XML parts. The theme folder contains themeOverride1.xml. As the name suggests, this is a theme that overrides the theme of an Office file that hosts it. This allows you to use a chart template in any Office document while retaining the original design appearance. Finally, we have the charts folder, which has the XML part we’re looking for.
This folder contains 2 files: style1.xml, containing the formatting for all the chart parts and colors1.xml, with a list of default fill colors and transforms fo apply to those colors. Colors1.xml is the file that supplies the colors when a new chart is created from the template. Here’s what colors1.xml looks like:
On a newly inserted chart, an Office program will use the 6 colors in turn. Then it will cycle through them again, applying the a:lumMod val=”60000″ transform. LumMod modifies the luminance, turning each accent color to a dark version. The chart will follow this pattern instead of using the colors you designed for the extra data series. If you reapply the chart type to the chart, then it will update with your designed colors from chart.xml
Fixing Chart Template Colors
My first step was to read the Microsoft specs for cs:colorStyle. Under section 2.8.3.2 CT_ColorStyle, it reads: “The total set of colors is all contained colors repeated each time with each variation applied. A color style can contain 6 colors and 7 variations. This yields a total of 42 colors with the first 6 having the first variation applied, the second 6 having the second variation applied and so on.” Not promising, we really need more than 6 colors here.
After many fruitless experiments, I decided to see if I could add extra colors anyway:
To my astonishment, it worked! I could create a new chart and insert 10 dataseries with each displaying the designed color. No need to reapply the template! Who would ever have dreamt that Microsoft documentation has a mistake in it! ;-D
The takeaway is that to create a many-colored chart template that works as expected under all circumstances, you need to set the extra color values manually in colors1.xml.
Unlike PowerPoint, Microsoft Word has a utility to create custom Word table styles. You might think this makes life a lot easier, but you would be wrong. The Word utility has quirks and bugs, and Word tables don’t work the same way as PowerPoint’s. Using the Table Style dialog is not intuitive. To get a Word table style to work exactly to the way it should, you may have to hack the OOXML.
To start, let’s clarify that a table style is one of 4 styles that you can create in Word. The others are paragraph, character and list styles. A well-constructed table style does not need to have paragraph styles applied to it later. That’s because it already contains paragraph styles, though these don’t have the conventional names that you’re familiar with. Here’s how to get the best possible results.
Start with a similar table style
The first step in creating a custom table style is to insert a table, so the Table Design tab appears. By default, a new table will use the Table Grid style, which is very plain. If your final table style requires design options like a distinctive first column or a total Row, Table Grid is a poor place to start. It doesn’t include any of those options, and adding them back in is difficult. Switch the style to a Microsoft default that already has similar features.
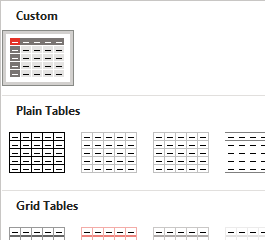
Next, expand the table style gallery dropdown again and select New Table Style at the bottom. This ensures that your table style will appear in a new Custom row right at the top of the styles gallery. By contrast, starting with Modify Table Style lumps your style in with all the Microsoft defaults.
Base the new style on the chosen one
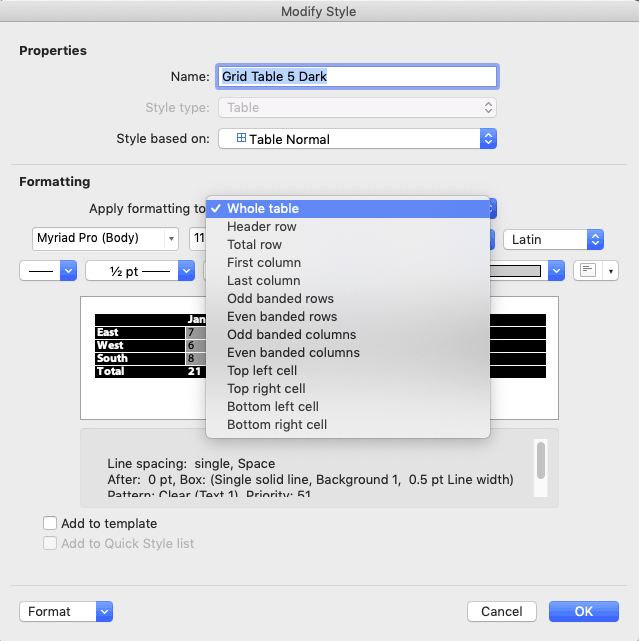
When you choose Table Design>Table Styles>New Table Style, Word sets the Style based on dropdown to Table Normal, not the style you chose. If you originally chose Grid Table 5 Dark, then set Style based on to the Grid Table 5 Dark. (Current versions of Word for Mac have a display bug whereby choosing a different table style does not update the preview in the dialog. Choose the style, OK out, then choose Modify Table Style to see a corrected preview.)
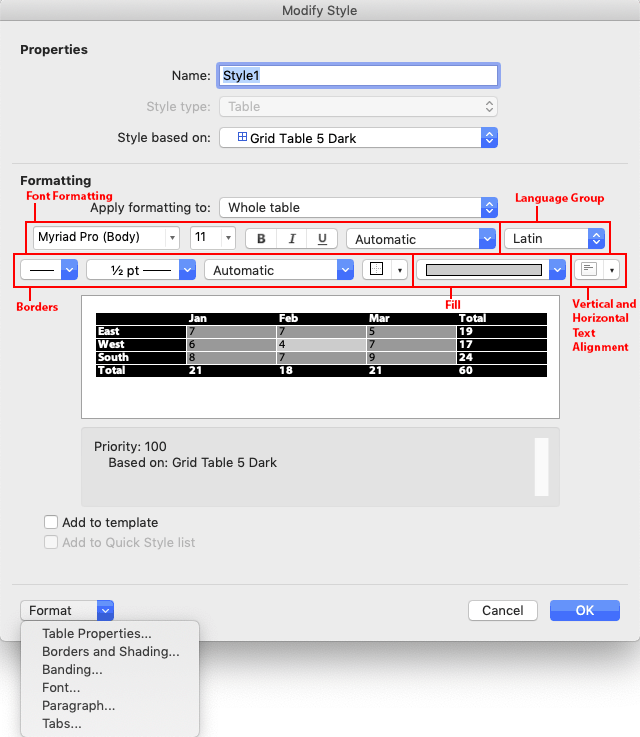
Start with Whole table
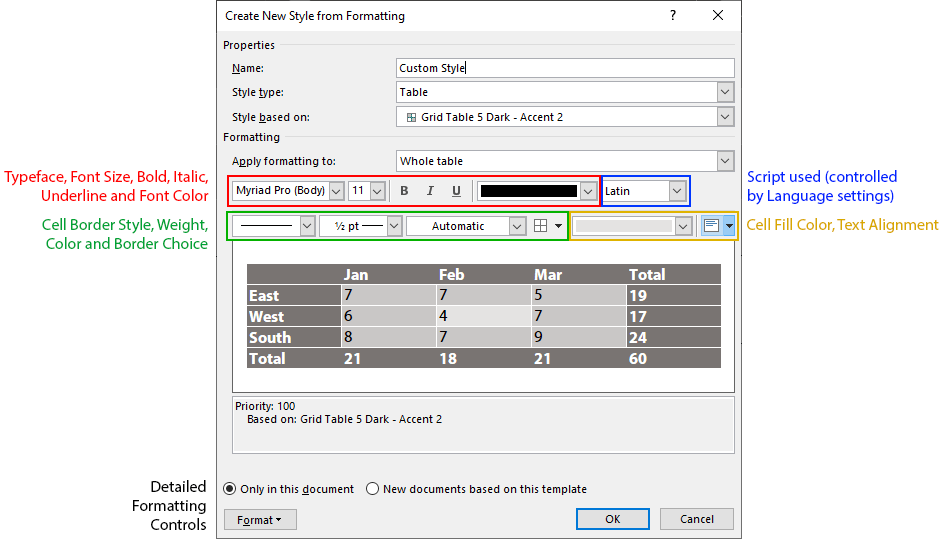
Start with the Whole table choice in the Apply formatting to dropdown. This is the default cell formatting that will appear when no other Table Style Options are applied. The formatting controls are condensed, here’s a breakdown of which control does what:
If the formatting control you need doesn’t appear in the dialog, use the Format dropdown in the lower left corner to access more of them.
Move on to Header row
After you’ve set the default cell style, choose Header row from the Apply formatting to dropdown. This is where the dialog gets buggy. Many of the controls will retain their value from whatever table part you were previously editing! The controls will sometimes, but not always, display the values used in the new table part you have just selected (in this case, Header row)! So it’s up to you to keep track of what the correct values are for the table part you’re formatting, and apply each in turn.
Format each table part in order
Because of the dialog display inconsistencies, it’s easiest to format each table part in the order they show in the Apply formatting to dropdown.
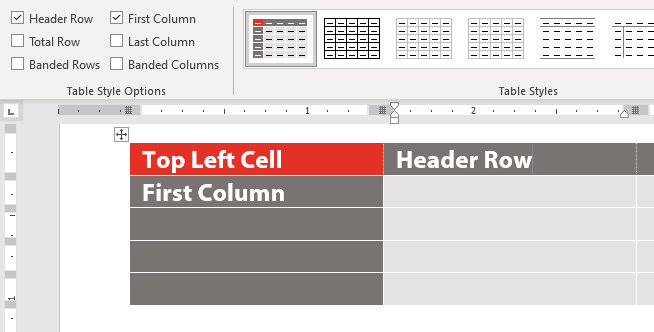
As you format each table part, Word creates, in effect, a separate paragraph style for each table part. But you don’t apply these styles by choosing a style name. Instead, you check a box in the Table Style Options group of the Table Design tab. Checking the Header Row option automatically applies the Header Row style to the top row of the selected table. When you’re creating a table style for a client, this means many design options can be included in one table style, and you don’t have to include elaborate instructions about which style to manually apply to which table part.
What about the corner cells?
The last 4 items on the Apply formatting to dropdown are to format the top left, top right, bottom left and bottom right corner cells. But there is no Table Style Option to turn these on and off directly. The way Word handles this is that if both the Header Row and First Column options are checked, then the formatting for the top left corner cell is turned on. This formatting can be different from either the header row or the first column. Header Row plus Last Column will turn on the upper right cell. You get the idea.
FWIW, PowerPoint table styles can also have corner cell formatting and the cell formatting is applied in the same way, by using pairs of style options.
Word Table Style Quirks
There are some oddities about Word table styles, and a few bugs. One oddity is that table text is based on the Normal style in relationship to Word’s Default Text settings. If Normal has been set to any color other than Automatic, applying different text colors to different table parts will have no effect. The text will remain the color set for Normal. You then have to apply new paragraph styles to the table parts after creating the table.
Another weird result of the dependency on Normal is that Word expects to have the default line spacing for your version of Word. As I write, Word 365’s default Normal style has a Line spacing of Multiple at 1.08 with Space After of 8 points. In a table style, this gets automatically reinterpreted as Single with 0 before and after. Centered vertical spacing then works as expected. If you change the Normal line spacing to a larger or smaller value, text that is nominally vertically centered will actually sit higher or lower in the cell. If you add 12pt after, the table text will jump from being vertically centered to having 12 pt after, a huge difference. Microsoft doesn’t publish any of this information. Surprise!
This is one of the reasons why Word experts recommend that Normal style should stay as is and not be actually used in a document unless the default formatting matches the needs of the design. Better to format all text as Body Text style and give that style the custom color and line spacing.
But what if you’re given a template that already has a non-standard Normal, and the client asks for a table style? All is not lost. Table styles can still work as designed if you are using Word for Windows (sorry, Mac people). The trick here is to set the document text defaults to the same values as the revised Normal style. (Thanks to MVP Stefan Blom for this tip.) Here’s how to do this:
With the document or template open in Word, click on the Styles pane dialog opener below the Quick Styles gallery, or press Alt + Ctrl + Shift + s at the same time. The Style pane opens.
Click on the Manage Style button at the bottom.
Select the Set Defaults tab.
Set the defaults to the same values as Normal style: same font, size, color and paragraph settings. OK out.
You’ll know you got it right when you insert a table in the new style and it automatically has the correct styling for header row, first column and the other table style options. It is no longer necessary to apply text styles to the table, you can simply turn the Table Design>Table Style Options on and off to affect the related table area.
Word Table Style Bugs
Lousy User Interface Design
In the table style dialog, color dropdowns remain set at the color last chosen, even if that was for a different table part. The dropdown should update to the color currently in use for the table part that has been selected. This is just common-sense UI design.
The interface for setting border styles is pretty bad. It’s almost impossible to set one color for vertical borders and a different one for horizontal borders. All borders switch to the last selected color. But we can fix this with an OOXML hack (see below).
Defective Override Capabilities
Subsequent parts can’t always override the XML of earlier parts. As an example, set the Whole table to have internal vertical rules. Then set the first column to have no rule on the right. This should make the vertical rule separating the first column from the second column disappear, but it doesn’t. The rule has to be manually removed after the table is created.
Non-Functional OOXML Tags
The Paragraph Properties (w:pPr) element for each table part has a pStyle attribute that is supposed to set the paragraph style for that part. It does nothing. As mentioned above, the style is always derived from Normal style.
Format the Word table style options in order.
Start by formatting the Whole table section with the defaults for cell in the middle of the preview. Most of the time, this will include the font size and color, and the table background color and any rules that are to appear if banded rows are turned off. If you can’t get the formatting you need from the few controls on the dialog, click on the Format dropdown to find detailed access to Table Properties, Borders and Shading, Banding, Font and Paragraph attributes. Under Windows, you’ll also see a Text Effects choice, which is of dubious value in a table.
Then move on to Header Row formatting, the next item on the Apply formatting to dropdown. Format each item on that dropdown until you have set all the properties you need. After you get all formatting set, apply the custom style to the sample table you created at the beginning. Then use Modify Table Style for any tweaks required.
Word Table Style Hacks
Default style formatting is hardcoded in Word. So the styles that get stored in a Word file are only styles that have been modified or newly created in the document. All of the style exceptions and new style definitions are stored in the word/styles.xml part. Here’s the OOXML for a full table style. First, the section that formats the whole table. Pr stands for Property. tbl is Table, tc is Table Cell, p is Paragraph and r is Run (any length of text less that a paragraph).
(Above) The w:rPr section sets the default text while w:tblPr sets the borders. This table is transparent when all design options are turned off, so there is no fill. Note the entries for w:insideH and w:insideV. I had to hack this XML to get different colors for the inside horizontal and inside vertical borders.
(Below) Next is the formatting for the header row. w:rPr sets the text as bold and white, while w:tcPr sets the cell borders to nothing and the fill to Accent 2.
(Above) The previous section formats the Total Row, removing the borders. There’s another hack here: the w:shd illustrates how to set the fill as No Color, with both w:color and w:fill set to auto.
(Below) Next up is the First Column formatting. w:pPr sets the text flush right, w:rPr makes it bold and w:tcPr removes the borders and keeps the fill No Color. Oddly, while w:insideH successfully overrides the internal horizontal rules set in the Whole Table section, neither w:right nor w:insideV are able to remove the internal vertical rule to the right of the column. This works as expected in a PowerPoint table style, but is broken in Word.
(Above) The right-most table column is formatted with no borders and no fill.
(Below) If your design includes banded columns, the table style will include a section like this. There is just a definition for odd columns: even columns would be formatted with the defaults from the Whole Table section. If the First Column option is turned off, odd columns start at the left-most column. If First Column is turned on, all columns shift and the column just to the right of the first column takes on odd column formatting.
(Below) Formatting for the 4 corner cells. These are only activated when both options that affect the cell are turned on. As an example, if the table has both a Header Row and a First Column, then the nwCell formatting is turned on. In the formatting for nwCell below, the text becomes flush right when both options are used.
If you base your Word table styles on a table other than Table Normal, that table style will be included in styles.xml. If that table style includes formatting that you don’t want to included in your table style, then delete the section in the style it’s based on. As an example, this style was based on Grid Table 3, which includes a last column and a total row. To remove all last column and total row formatting from your style, delete the corresponding XML sections in both your custom style and in the style on which it’s based. You’ll know when you’re succesful when turning the Last Column and Total Row Design Options on and off in Word has no visual effect on a sample table.
Too complicated? Shoot me a message and we’ll create custom Word table styles for your document or template.
For Office users, the closest thing to a “programming language of the people” is VBA. It’s not too hard to get started, there are gobs of help information from a good search, and the results are immediate. But VBA’s abilities haven’t expanded as its environment has changed. This has become abundantly clear with current versions of Office, where task panes and the Windows-version Backstage haven’t been included in the VBA object model. Many want to edit OOXML with VBA, but Microsoft prefers to shuffle you off to the Open XML SDK programmed with C# to do that job.
Fortunately, we’re on the case at Brandwares. We collaborated with programmer Jan Karel Pieterse to develop a PowerPoint version of his macro set that edits Excel OOXML. We’re making this freely available as a download so you can get the benefit of this.
Let me apologize to my macOS readers. I really try to provide solutions that work cross-platform, but this macro set relies on Windows system calls.
I’ll be honest, this isn’t the most elegant OOXML editing solution. The macro set unzips the OOXML to its component files, gives you the opportunity to edit the XML using VBA string manipulation, then rezips the OOXML to a usable PowerPoint file. The unzip/rezip operations are fairly slow, especially with large files. It’s not something you can use in a real-time editing situation.
One of Brandwares’s specialties is converting legacy presentations to new themes/templates. Often, there are OOXML mismatches that make reused slides retain artifacts or formatting from the old decks. We solve these issues with macro convertors that take a folder full of old decks and transform them into new presentations with new branding. This macro set is great for that.
Edit OOXML with VBA: a Peek Under the Hood
THe file contains 3 VBA modules and 1 class module. Module modConvert is the only one you need to modify. In it, Sub MainVBAOperations does the actual work of opening files, saving as a work file, calling the XML process, saving the modified file and deleting the work file. This is also where you would do any additional VBA processing. As one example, after you modify the XML of a slide master or layout, you have to reset the slide based on it to display the changes. MainVBAOperations is where you would do this.
The other Sub is ProcessXML. Here’s where you unzip the file being modified, open different XML parts for find and replace processes, followed by a rezip of all files back to a working file. The sample code in this module shows a typical revision to the idx numbers of placeholders, a common requirement of legacy presentation conversions and one that can’t be done with the PowerPoint interface.
The module modDisplay, by Shyam Pillai, provides the PowerPoint equivalent of the Application.Screenupdating command that exists in Word VBA. Useful to prevent the screen flashing and jumping as files are processed, it also helps speed code execution. modUNC by Randy Birch, assists with file management.
Jan Karel Pieterse wrote the class module clsEditOpenXML that does the heavy lifting of unzipping and rezipping the document to be modified and reading and writing the XML.
As noted in the code, You are free to use this code within your own applications, add-ins, documents etc but you are expressly forbidden from selling or otherwise distributing this source code without prior consent. This includes both posting free demo projects made from this code as well as reproducing the code in text or html format.
Converting Legacy Presentations
We use often use this macro set to update old (legacy) presentations with a new design. Successful updating requires meeting 5 criteria, please read this article for more details: Legacy Slides – Best Practices. As noted on that page, the 5th requirement is that placeholder idx numbers in the OOXML must match on the old and new layouts. There’s nothing in PowerPoint’s interface that allows you to set idx number, but this macro set allows you to do just that. The pre- and post-processing sections of the macros allow you to set the the other 4 parameters for each slide layout. Click here to download it.
The following advice is particular to presentation conversion. It’s routine that slide masters and layouts will be changed in that process. Then, to apply those changes to the actual slides in a presentation, the slides must be reset, as if you pressed the Home>Reset button in a presentation. Resetting slides wipes out character-based formatting. If a user has applied bold or italic or an underline to particular text, that all will disappear. It’s important to notify your client of this. To make an exact update would require a painstaking construction of a multi-dimensional array for each placeholder on each slide that would record all character-based formatting, then restore it after the update, for which you would have to charge many times as much as for the basic conversion work.
Brandwares is a world leader in presentation updating and conversion. We’re available for presentation assessments, to identify potential problems. We have multiple techniques for seamless re-use of legacy presentations. Contact us when you’re redesigning to ensure your new template will reuse your old slides without a hiccup.
Replacing odd fonts and errant languages in PowerPoint is not something that always works well in the program. Problems with replacing double-byte fonts for Asian languages have been documented on other pages, but designers also have problems replacing Mac-only formats like AAT (Apple Advanced Typography) fonts.
There’s a similar problem with languages. While language tags are scattered all over in XML, you can only reach some of them with PowerPoint’s built-in Review>Language>Set Proofing Language (Windows) or Tools>Language (macOS) command. When files are moved between computers, it’s very easy for the file to have a mix of language tags.
In Windows, there are some free macros available to make replacing languages easier in PowerPoint, but there’s no equivalent for Macs. So here’s my go-to method to fix both problems with not much more than a good text editor, like NotePad++ in Windows and BBEdit on Mac. If you’re new to this site, please read my introductory articles OOXML Hacking: An Introduction and, if you’re on a Mac, OOXML Hacking: Editing in macOS.
Referring to the macOS article, a patient Mac user can use BBEdit 11 or better to open a presentation, select each file in turn and get the job done. But your time will be better spent by creating a network or USB disk that doesn’t create .DS_Store files. It’s a little time-consuming the first time, but if you’re someone who creates PowerPoint files on a regular basis, you’ll soon recover that time. The nice thing about this technique is that it always works, 100% of the time, even with double-byte fonts.
Replacing Fonts in PowerPoint
Unwanted fonts can be introduced when you’re doing design experiments, collaborating with clients, or when you convert a KeyNote presentation to PowerPoint. In all these cases, you may end up with fonts you cannot remove, or even with a deck you cannot save. Start by making a list of all fonts that need to be eliminated. You can get the names by choosing Home>Replace>Replace Fonts (Windows) or Edit>Find>Replace Fonts (macOS menu). Then expand the PowerPoint file to XML parts.
Now fire up your text editor. Both BBEdit and NotePad++ include utilities to find and replace in files. With both, you point the find at a folder full of expanded XML files from your presentation. In the Find field, look for typeface=”Font Name”, where the font name is the name listed in Home>Replace>Replace Fonts (Windows) or Edit>Find>Replace Fonts (macOS menu). The Replace field should also be typeface=”Font Name”, but here the font name is the font to match the rest of the deck. Executing the Find and Replace should display a list of files where changes were made. Both programs automatically save the changed files, so all you have to do is close the text editor and rezip the XML back to a presentation.
Windows users can take a shortcut with this process. PowerPoint for Windows has a save format called PowerPoint XML Presentation (*.xml). This saves the entire presentation as one big XML file. Open that file in plain old NotePad, choose Edit>Replace and do the same replacement as above. No fancy text editor needed! Then open the XML file in PowerPoint and save to a normal presentation format for your client.
Replacing Languages in PowerPoint
PowerPoint puts language tags all over the place. Here’s a random sample showing one paragraph with one word that contains 2 different language tags!:
The technique is nearly identical to font replacement, you just search on a different tag. In the example above, we would find lang=”en-CA” and replace it with lang=”en-US” to create a uniform U.S. English presentation. Here at Brandwares, we do a lot of international work, so files can have language tags from all over. A standard part of file finalization is replacing language tags with the target language for the client.
When you’re working with OOXML files, multifile find and replace is a very useful technique to solve all kinds of problems. As another example, here’s my article on fixing broken color themes with similar techniques: OOXML Hacking: Repairing Color Themes. Mastering multifile find and replace can save you hours over manual repairs to PowerPoint files.
Is your problem more complex? You just can’t get the result you want with find and replace? That’s why we’re here, to help you get your work done faster! Shoot me an email at production@brandwares.com, I’ll get you going in a jiffy.
Microsoft doesn’t have a catchy name for this feature, but I’ll try to describe it. In Word for Windows, you can select document text, then apply Read-only protection, but with Exceptions. By default, the exception is Everyone. If we untangle the word logic, this means that the document becomes read-only except that everyone can edit the selected text. It’s a far better solution than the old protection for forms.
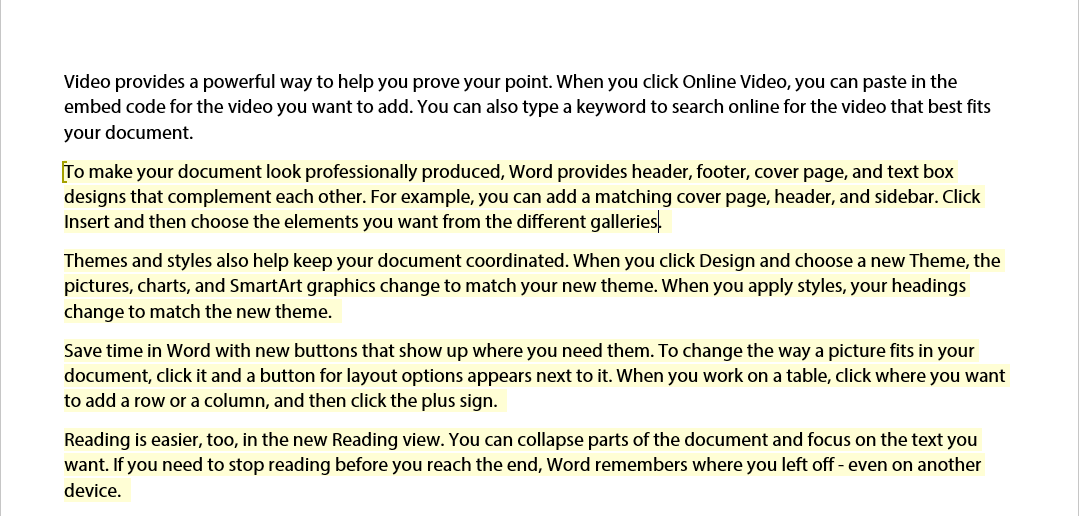
When this type of protection is applied, the selected areas become shaded in light yellow as a visual cue that the highlighted text remains editable. Users of Word 2016 for Mac and 2019 for Mac (including Microsoft 365 subscribers) can use these documents, but can’t produce them. At least, until now.
Light yellow areas indicate editable text
Word pros will look at the square bracket and think it’s a bookmark. It’s not. Microsoft reused the bookmark character to show a Permission Range. To add these editable ranges on a Mac, we’re going to create one manually.
To start, apply Read-only protection to the document. Use Tools>Protect Document, then check Protect document for. Click on Read only, then on OK. Save the file.
Now open the file in your XML editor. OOXML Tools in the Chrome browser is fine for this job. Open document.xml inside the word folder.
Just before the text that you want to be editable, insert a line like this:
The beginning and end tag must have the same 9-digit random number. Each pair of tags in a document must have a different random number.
Here is a whole paragraph marked as editable:
<w:permStart w:id="783447734" w:edGrp="everyone"/>
<w:p w14:paraId="5B68C6A9">
  <w:r>
    <w:t>To make your document look professionally produced, Word provides header, footer, cover page, and text box designs that complement each other.</w:t>
  </w:r>
</w:p>
<w:permEnd w:id="783447734"/>
It’s that simple. Save the file and distribute to users.
For any of our tips that seem too complicated, Brandwares is available to do it for you. We teach the pros!
Fix It with VBA
Instead of hand-editing the XML, then applying Read-only protection, you can use a bit of VBA to solve this problem. Select the text that should remain editable, then run this macro:
Sub CreatePAE()

  Selection.Editors.Add wdEditorEveryone
  ActiveDocument.Protect Password:="", NoReset:=False, Type:=wdAllowOnlyReading, UseIRM:=False, EnforceStyleLock:=False
End Sub
If you have multiple areas that should remain editable, run the macro, then unprotect the document (Tools>Protect Document>Uncheck Protect document for option), select new text, then re-run the macro. Leave the document protected before distributing it.
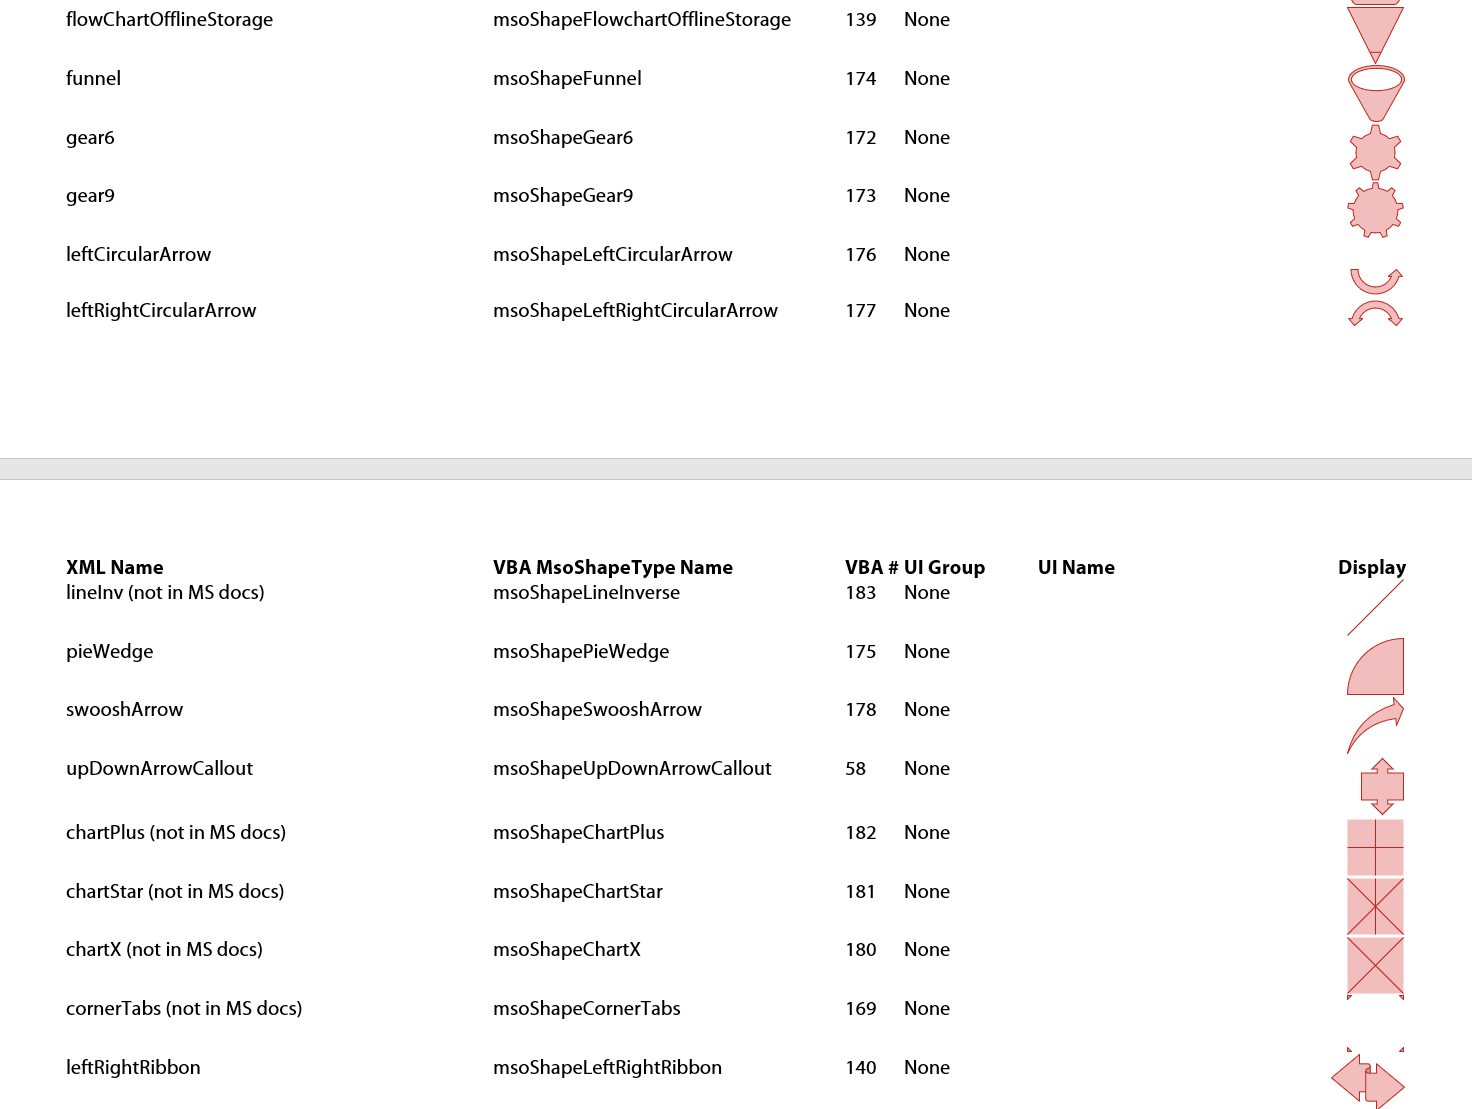
There are more AutoShapes in Office than appear in the user interface. Over time, Microsoft has quietly added to the collection stored in Office. Many of the more recent shapes are used in SmartArt files, while others have no current use that I can detect. But for anyone who hacks XML or codes VBA will find this week’s download or every autoshape a useful reference.
These are all the shapes that can be used in a piece of SmartArt. This is a deep topic: SmartArt XML is a programming language with a Frankenstein syntax. But the starting point for any language is to get the names right. SmartArt and VBA both reference the AutoShapes collection in Office, but they use different names for the same objects. Many of the same shapes are seen in the Shapes dropdown of Office programs, but those names are also different. The main source of the VBA names are from this page: MsoAutoShapeType enumeration (Office), while the XML names come from this out-of-date listing: SmartArt AutoShapes.
So, for my own sanity, I created a Word document showing an example of each shape, along with it’s name in XML, in VBA and in the user interface. This has smoothed out my workflow, and it may help you as well.
For any non-interface shapes, you can insert them into a document with code analogous to this. For PowerPoint:
Sub MakeShape()
  ActivePresentation.Slides(1).Shapes.AddShape msoShapeTrapezoid, 24, 24, 144, 144
End Sub
Change the bolded word to the shape name in the VBA MsoShapeType Name column.
Some shapes have specialized VBA commands, like callouts:
Sub MakeShape()
  ActivePresentation.Slides(1).Shapes.AddCallout msoCalloutTwo, 24, 24, 144, 144
End Sub
Callouts led me to a discovery about legacy versions. msoCalloutOne gives exactly the same result as msoCalloutTwo in current versions of Office.That seemed odd, so I ran the same macro in PowerPoint 2003 (I still have it installed for its macro recorder). In that version, msoCalloutOne creates a callout with a vertical leading line that can be moved up and down, but not at an angle. Presumably, MS found that useless and deprecated it.
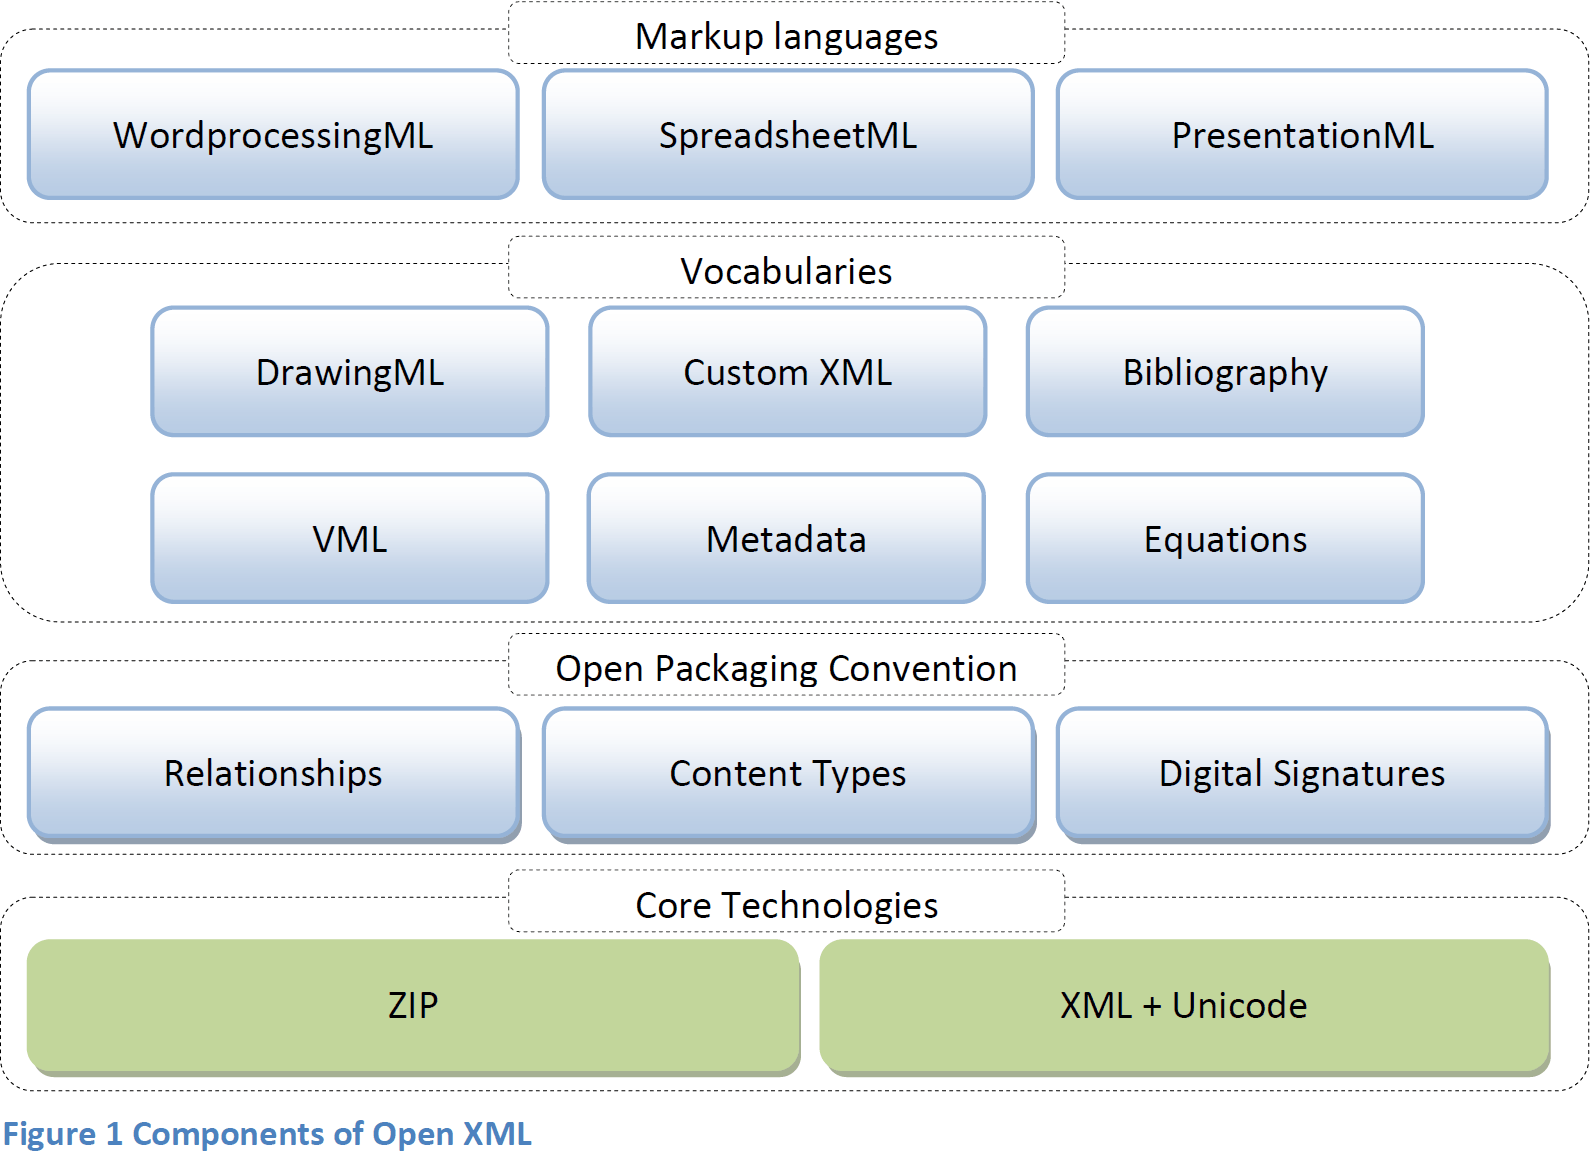
We’re proud to be hosting a free e-book Open XML Explained. Finding readable explanations of how Office Open XML works isn’t easy. Outside of the very dense published ECMA standards, most of the information exists only on the web in help pages and blog posts. Back in 2007, a developer in the Netherlands, Wouter van Vugt, published a well written PDF that goes into details about the XML formats used in Word, Excel and PowerPoint. This was originally posted on the openxmldeveloper.org website run by OOXML genius Eric White.
Eric’s site closed down some years ago and much of the content disappeared. But I’ve been able to track down a copy of Wouter’s book and have his permission to give it a new home here at Brandwares. Download Open XML Explained.
The e-book covers Excel, Word and PowerPoint in depth, covering otherwise obscure topics like table formatting, bullets and charts. It’s an excellent companion to my book, covering the theory behind my practical techniques. OOXML hackers will appreciate the explanations of all the major XML parts in an Office file, while coders will find this a useful resource in learning how to programmatically create and modify documents, workbooks and presentations.
I should note that Open XML Explained was written in 2007, so while it covers all the OOXML basics, it doesn’t have any information about newer features like the Backstage or SuperThemes. Reader David Wiggins was kind enough to find the sample files that accomapied the book. The download page has a link to them as well. Enjoy!