This is such a common problem, I thought I’d write a short article about why it happens and how to solve it. The symptom is that you apply a numbered style to text, but when the number reaches 10 (or 100, or some other fixed width), the indentation of the text jumps. The effect looks like this:
This happens because the tab setting of the list style is too small. When you reach a number that is wider than the tab setting, the indentation jumps to the next available tab, which may be a default tab that you didn’t even set in the style. To fix the issue, you must increase the tab width in the list style. Here’s how to do that.
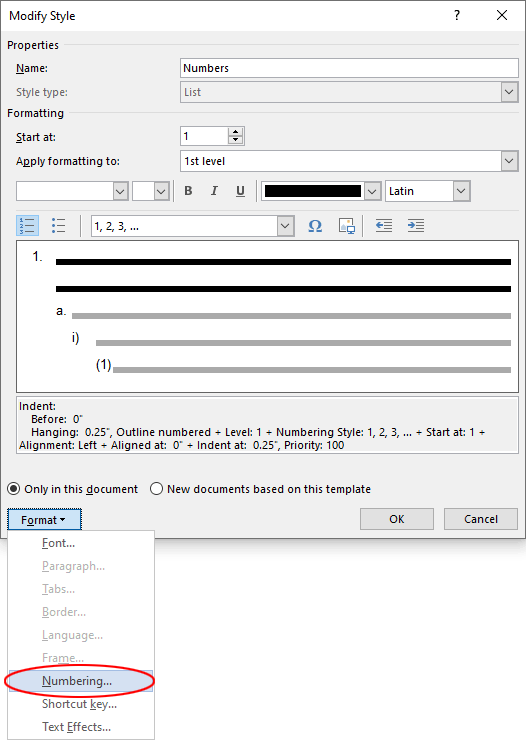
With the insertion point flashing in the problem numbering, choose the Home tab, then click on the third button in the Paragraph group. This is the button that displays Multilevel List when you hover over it. Do not click on the second button, which is currently highlightlighted. Click on the third button, then look for the highlighted List Style near the bottom of the dropdown. Right-click on the highlighted style and choose Modify. The Modify Style dialog opens.
In the Modify Style dialog, click on the Format button and choose Numbering:
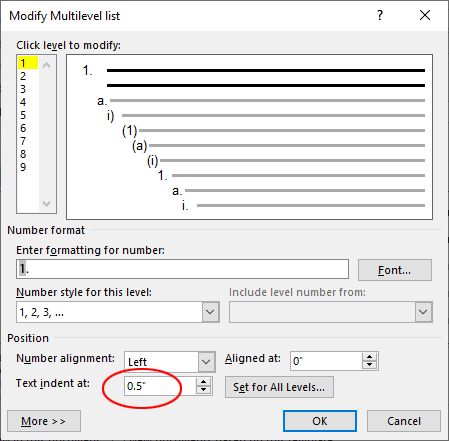
The Modify Multilevel list dialog opens. Choose the text level causing the problem and adjust Text indent at to a larger amount.
If your list style has more levels below, you may have to increase their indentation as well to keep the levels aligned. When you’re done, OK out. The text indents pop to the right, leaving plenty of room for larger numbers:
In a corporate environment, you normally need new documents to appear with company branding instead of reusing Microsoft’s designs. Here’s how to set a default template or theme so that each new document, presentation or workbook looks like your company guidelines (or your personal preferences).
Template or Theme – Choosing a Format
Templates contain a theme, but a theme is much simpler than a template. You may need to create both types of files. If your goal is to create a unified look in Office, you’ll want to create a theme, then apply it to templates in Word and Excel.
A Theme file contains a Color Theme, a Font Theme and an Effects Theme. It also contains the slide layouts that were in the PowerPoint file when you saved it as a theme. For this reason, you can use a theme as a mini template for new PowerPoint presentations.
Themes provide minimal formatting information for the templates to which they are applied. A theme will supply a set of 12 colors, 2 fonts and a set of visual effects for inserted shapes. It’s possible to add up to 50 custom colors to a theme. Effects themes format the defaults for inserted shapes, but are not editable in any version of Office. I recommend our Flat effects theme, which is more in tune with current graphic design trends than what Microsoft supplies.
When your goal is a full-featured starting point for new files, you’ll want to create a template instead of a theme. Templates can include sample content, typestyles, VBA macro programming and AutoText, depending on the file format. Here at Brandwares, we almost always supply templates rather than themes.
Create a Better Default Template Experience
In Office on both Windows and Mac, Microsoft has decided that the first thing you need when you open an Office program is to be offered a creative choice in what kind of off-brand document you’re going to create today. In a corporate environment, or really any circumstances where you just need to get work done, this is an unneccessary distraction. You really just need to have a default document open so you can get down to business.
If the Backstage or Gallery displays, when an Office program starts, the program will not automatically create a new file from the default template. You would have to have a file open, then press Ctrl + N (Command + N on a Mac) to create a new file from your template. This limits the usefulness of a default template.
In Office for Windows, you’ll get a better default document experience if all the programs do not show the Backstage on starting. In all three programs, choose File>Options>General and uncheck Show the Start screen when this application starts. Once you do that, opening the program will also open a file created from the default template.
Office for Mac features similar Gallery screens that open by default when the program starts. Turn these off. In PowerPoint, choose PowerPoint>Preferences>General and uncheck Open Presentation Gallery when opening PowerPoint. In Word, choose Word>Preferences>General and uncheck Show document gallery when opening Word. Excel is similar: Excel>Preferences>General and uncheck Show Workbook Gallery when opening Excel.
Set a Default Template or Theme in PowerPoint
I’m starting with PowerPoint because it’s the only Office program that can save a Theme file. In Office for Mac, PowerPoint is also the only program that can create a Color Theme,. (To create a custom Font Theme in Office for Mac, please see this article: OOXML Hacking: Font Themes.) A theme created in PowerPoint can be applied to Word and Excel to give a basic uniform look to documents and workbooks. Theme files cannot contain sample slides, custom table styles, VBA code or preformatted Notes or Handout masters. If you need any of those items, create a template instead of a theme.
Unlike Word, PowerPoint doesn’t have a source file that serves as the starting point for new presentations, analogous to Normal.dotm in Word. But you can give it one! Start by making a copy of your template or theme. Templates will have a file ending of .potx or .potm, while themes will end with .thmx. Change the file name to Default Template, leaving the file ending unchanged.
Here are the steps in PowerPoint for Mac:
While holding down the Option key, click on Go in the macOS menu bar and choose Library. Your hidden user Library folder opens.
Navigate to ~/Library/Group Containers/UBF8T346G9.Office/User Content/Themes
Drag the Default Theme template or theme into the Themes folder.
Open PowerPoint and choose File>New Presentation or press the Command + N key combination to create a new presentation. The new deck is formatted per your template or theme.
Here are the steps for PowerPoint for Windows
Open a File Explorer window
Copy and paste this text into the address bar: %appdata%\Microsoft\Templates\Document Themes
Drag the Default Theme template or theme into the Document Themes folder.
In PowerPoint, use the Ctrl + N keyboard shortcut to create a new file from your default template or theme. Or choose File>New, then click on the Default Theme icon at the upper left end of the row of recently used templates and themes.
Set a Default Template or Theme in Word
Setting a template default in Word can be a bit tricky, because Word already has one: the Normal.dotm file. The wrinkle is that Normal.dotm is also the default storage location for user-created content like macros, custom typestyles and AutoText. A minimalist approach is to apply a new theme to an existing Normal.dotm, sidestepping those issues.
Set a Default Theme in Word
A Word-created Normal.dotm always has the Office theme applied to it. You can set a different theme for new documents by editing Normal.dotm and applying a theme file you’ve created in PowerPoint. This is safe for user-created content, as no content is deleted. Custom styles that were based on the Office theme will change appearance, but otherwise keep their characteristics.
Themes are limited in scope, but if your branding goals are limited, that may be enough. Here are the steps for macOS:
With Word open, press Option + F11. The VBA editor opens.
Press Command + Ctrl + G. The Immediate window opens in the VBA editor.
Copy and paste this text into the Immediate window, then press return: application.NormalTemplate.OpenAsDocument
The Normal template opens in Word. Close the VBA editor.
Choose Design>Themes>Browse for Themes, find and select the Theme file you saved from PowerPoint, then click on Open.
Save Normal.dotm, then close it.
Here are the steps for Word for Windows:
With Word open, press Alt + F11. The VBA editor opens.
Press Ctrl + G. The Immediate window opens in the VBA editor.
Copy and paste this text into the Immediate window, then press Enter: application.NormalTemplate.OpenAsDocument
The Normal template opens in Word. Close the VBA editor.
Choose Design>Themes>Browse for Themes, find and select the Theme file you saved from PowerPoint, then click on Open.
Save Normal.dotm, then close it.
Replace Normal.dotm in Word
If your users may have saved macros, styles or AutoText content, make a copy of Normal.dotm before replacing it, then to use Word’s Organizer feature to copy custom content back to the new template. Here is the procedure to replace Normal.dotm in Word for macOS:
Close Word
While holding down the Option key, click on Go in the macOS menu bar and choose Library. Your hidden user Library folder opens.
Navigate to ~/Library/Group Containers/UBF8T346G9.Office/User Content/Templates
Drag in the new Normal.dotm file and confirm that you want to replace it.
Restart Word to test that a default document matches the new formatting.
The steps for Word for Windows are complicated by Microsoft’s June 2024 change to the default location of Normal.dotm. These instructions cover Word 2019 and older editions:
Close Word
Open a File Explorer window
Copy and paste this text into the address bar: %appdata%\Microsoft\Templates
Drag the new Normal.dotm file into the Templates folder and confirm that you are replacing the file.
Restart Word to test that a new document matches the new formatting.
As of June 2024, for Microsoft 365 and Word 2021, Normal.dotm has been moved to the Custom Office Templates folder in the user’s Documents folder. The default path is C:Users\YourActualUserName\Documents\Custom Office Templates
Set a Default Template in Outlook
Outlook uses the template called NormalEmail.dotm to set email formatting. It’s stored in the same folder as Normal.dotm. Follow the same steps as for Normal.dotm: close Outlook, edit NormalEmail.dotm in Word (not Outlook), then replace the template. It’s unlikely that NormalEmail.dotm will contain macros, custom styles or AutoText, so you don’t need the precaution of backing up the file before replacing it.
Set a Default Template in Excel
After formatting a workbook with a custom theme, typestyles and any other necessary formatting, save the file in template (.xltx) format with the name Book.xltx.
PowerPoint for Mac Excel steps:
Close Excel.
While holding down the Option key, click on Go in the macOS menu bar and choose Library. Your hidden user Library folder opens.
Navigate to ~/Library/Group Containers/UBF8T346G9.Office/User Content/Startup/Excel
Drag the Book.xltx file into the Excel folder.
Open Excel. In Excel for Mac, opening the program creates a new workbook from your template. You can also choose File>New Presentation or press the Command + N key combination to create a new workbook. The new deck is formatted per your template.
Excel for Windows doesn’t work as well as it used to Book.xltx, so there are more steps:
Close Excel
Open a File Explorer window
Copy and paste this text into the address bar: %appdata%\Microsoft\Excel\XLSTART
Drag the Book.xltx into the XLSTART folder.
Open Excel to test.
I also recommend that Windows users add a second copy of Book.xltx to the Custom Office Templates folder at C:Users\YourActualUserName\Documents\Custom Office Templates. Call this one something like Default Workbook. The first time you use it, you’ll need to choose File>New>Custom Office Templates to choose it. After that first use, it will display in the row of Excel templates:
In PowerPoint for Windows, you can’t get rid of the Blank Presentation thumbnail. Clicking on that will only get you a Microsoft default presentation. Likewise, in Excel for Windows, you can’t remove Blank Workbook, which also delivers a Microsoft default.
Most of the time, the Microsoft-supplied Table of Contents samples will work for Word documents. But sometimes a client needs a custom Table of Contents added to their template. This article shows you how to save a custom Table of Contents and ensure that is displayed prominently, so users pick the right one.
The most obvious use case for customization is to create a non-standard TOC that uses the client’s branding. In addition, sometimes a TOC needs to work differently as well as having a distinct appearance.
An example of this might be if a template uses both heading styles (which need to appear in the TOC) and outline numbering styles (which should not be included in the TOC). A default Microsoft TOC will display both sets of styles, so a custom TOC is required.
How Does a Table of Contents Work?
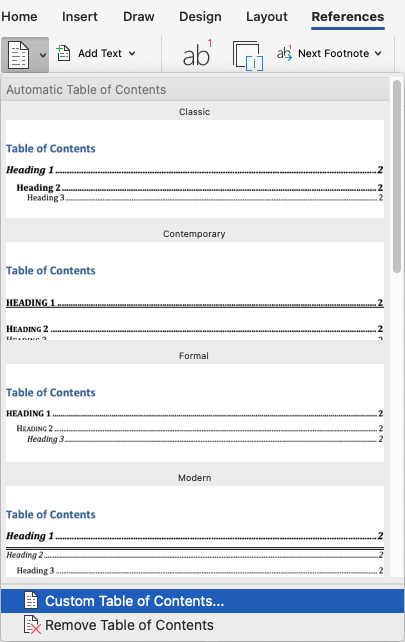
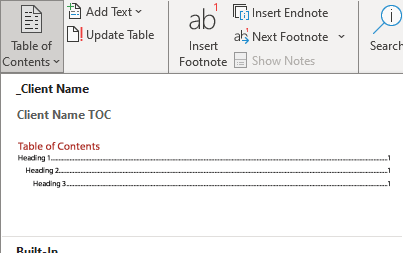
A standard TOC is a collection of hyperlink fields inside a TOC field. If you insert one of the Microsoft-supplied TOC samples, those fields are embedded in a Content Control. This content control is not particularly useful. It gives you a way to change to a different style of Microsoft TOC (not helpful in branded documents) and a slightly more convenient way to update the TOC. You can create a TOC without a content control if you use the Custom Table of Contents command (highlighted in blue) to create it:
Tables of Contents usually get their text from text that is formatted with heading styles. The Microsoft TOCs grab all headings that are levels 1, 2 or 3, which is why they are a problem with outline numbering. When you create a custom Table of Contents, it can refer to specific heading styles, like Heading 1. Then, no other styles will be included in the TOC.
Most often, a template that has a custom TOC will have it added to the document already. Since there’s a sample in the file, users don’t need to add one. The sample has the required formatting, the user only needs to add text to the document before updating the TOC.
Create a New Custom Table of Contents
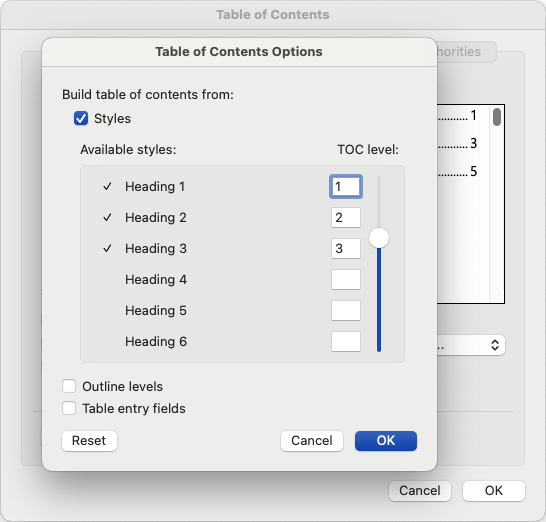
Here at Brandwares, we never use the Microsoft-supplied TOC styles. Instead, we create each TOC from scratch using References>Table of Contents>Custom Table of Contents. Then we click on the Options button and uncheck Outline levels. That prevents other styles that use outline numbering from displaying in the TOC. Finally, we select the specific styles that are supposed to appear.
If the TOC is to have a heading above with the text “Table of Contents”, you’ll want it to look like one of the document headings styles. But you don’t want it to actually apply that style to the heading: then the first entry to appear in the TOC would be a repeat of the heading directly above it! Fortunately, Word has a built-in styles called TOC Heading that solves this problem. It repeats the appearance of Heading 1, but it’s outline level is set to Body Text, so it will not repeat in the TOC.
Customize Existing TOC Appearance
The look of a table of contents is determined by the styles that are used in it. There are 9 built-in styles called TOC 1, TOC 2, etc. up to TOC 9. Since there are 9 styles, you can create up to 9 levels in a Table of Contents. Or a document can have setup like a Table of Contents, a Table of Figures and a Table of Tables, each of which use three different TOC styles. Each of these styles can have different amounts of indentation, different types of dot leaders between the text and the page number, different line spacing, etc. All the visual formatting will be set in these TOC styles.
Customize how a Table of Contents Works
Besides the visual appearance, you can control how the Table of Contents operates. To do this, you change the field code that tells Word how to display the TOC. To revise the TOC field code, you need to be able to see it:
In Word for Windows, choose File>Options>Advanced. Scroll down to the Show document content section and check the option for Show field codes instead of their values. OK out.
In Word for Mac, select Word>Preferences>View and check the option Field codes instead of values, then close the prefs panel.
The TOC changes to something like this:
{ TOC \o "1-3" \h \z \u }
The brackets are not ordinary curly brackets: they are special characters that begin and end Word fields. So you can’t just type them in on your keyboard. The contents of the field are editable from the keyboard, just not the brackets. At the beginning of the field is the name of the field type, in this case TOC for Table of Contents.
After that are a set of switches (the letters after backslashes). Each switch makes the TOC behave differently. The sample from Microsoft use the \o switch followed by “1-3”. This combinations grabs all text that is set in the built-in styles Heading 1, Heading 2 and Heading 3. After that, the \h switch creates hyperlinks from each TOC entry to the heading that it refers to. The \z switch hides the dot leaders and page numbers if the document is in Web View. And the \u switch gets all text that is set to outline levels 1, 2 or 3. It’s this switch that creates problems when you also have outline numbered lists, since they use the same text levels as heading styles do.
To make a TOC display only Heading 1, 2 or 3, just delete the \u switch. If the heading styles have custom names, then delete the \o switch and the “1-3” text. Instead, use the \t switch. That switch specifies styles name, followed by the TOC level that the style should use. Here’s a TOC field that uses three custom heading styles:
Select the Table of Contents, plus the paragraph mark immediately below it. Then right-click on the selection and choose Toggle Field Codes. Or just press the combination of Shift + F9. This shows the field codes for the selected area instead of the whole document. If you see a field code for a Hyperlink instead of a TOC, it means you forgot to select the paragraph mark below the Table of Contents.
Word for Windows Insertable Custom Table of Contents
If the TOC is not to appear in the template as a sample, then the user must have a way to insert it when needed. The simplest way to do this is to add the TOC to the template as AutoText. AutoText entries travel with the template, so they are always available in any document created from that template.
The first wrinkle to overcome is that if you simply select the TOC and add it to AutoText, it can be stored with all of the current displayed text. This will be misleading to the user. To prevent this, switch the document or the selected TOC to show the field codes first. Then select the field code and add that to AutoText.
In Word for Windows, follow these steps:
Select the TOC heading, plus the TOC field code and the paragraph mark immediately following.
Choose Insert>Quick Parts>AutoText>Save Selection to AutoText Gallery.
In the Create New Building Block dialog, edit the Name field. It’s usually a good idea to include the client name, so their users know this is the TOC they should pick.
Change the Gallery dropdown to Table of Contents.
In the Category dropdown, choose Create New Category.
In the Create New Category dialog, type in a name like _Client Name. The underscore preceding the name makes the entry pop to the top of the list
.
Double check that the Save in dropdown is the name of the template to which you’re adding this TOC. OK out and save the template.
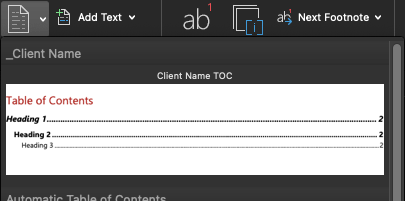
On the References tab, click on the Table of Contents dropdown and you should see something like this:
Word for Mac Insertable Custom Table of Contents
You can achieve the same result with Word for Mac, but Microsoft makes it more difficult, since they omitted the Create New Building Block dialog. I’ve written previously about hacking AutoText entries to place them in the correct AutoText Gallery. But here’s an easier way, using a VBA macro.
Here’s the macro listing:
Sub AddTOC2Gallery()
    Dim oTemplate As Template
    Dim oBlock As BuildingBlock

    Set oTemplate = ActiveDocument.AttachedTemplate

    Set oBlock = oTemplate.BuildingBlockEntries.Add( _
        Name:="Client Name TOC", _
        Type:=wdTypeTableOfContents, _
        Category:="_Client Name", _
        Range:=Selection.Range)
End Sub
This macro will work with the template that will contain the TOC, or a document attached to that template. Yes, we did test this in macOS and Windows, so if you have problems running it, the issues are at your end.
Switch the document or the selected TOC to show the field codes first. Then in Word for Mac, follow these steps:
Edit the macro, changing the text in double quotes to suit your client.
Select the TOC heading, plus the TOC field code and the paragraph mark immediately following.
Run the macro.
Save the template.
On the References tab, click on the Table of Contents dropdown and you should see something like this:
Further Reading
For more detailed pages about Word TOCs, please see Generating Table of Contents in Word. It’s also worth reading Susan Barnhill’s TOC Tips and Tricks and TOC Switches. Though the Barnhill articles are old, they contain obscure information that is still relevant, like how to set up a TOC that doesn’t depend on styles or outline levels.
Office has the abilty to insert 3D models and to create 3D shapes. Both of these using lighting, but the Office interface does not include any lighting controls. To change 3D lighting, you have to hack the XML.
There is very little documentation online for 3D lighting in OOXML aside from the Microsoft pages at 2.31 http://schemas.microsoft.com/office/drawing/2017/model3d. The am3d element that represents 3D models does not appear in the older ECMA-376 reference that defines the Office file formats. ECMA 376 has been superceded by ISO/IEC 29500-1:2016.
When a 3D model is inserted in an Office document, the model file is storeed in the media subfolder, along with a PNG rendering of the view of the model when the document was saved. The PNG is displayed when the document is re-opened and serves as a fallback image when the file is viewed in an earlier version of Office that doesn’t support 3D models.
The rendering information for the model is stored in the document, not in the embedded model file. In Word, the rendering information is stored in word/document.xml. In PowerPoint, it is kept in ppt/slides/slideX.xml, where X is the slide index number. In Excel, look xl/drawings/drawingX.xml.
3D models use scrgbClr parameters for lighting color with numbers expressed in a percentage. But unlike scrgbClr elsewhere in Office, the syntax is not r=”50%” g=”50%” b=”50%”. Instead, use whole numbers with three zeros added, so 50% becomes 50000: <a:scrgbClr r=”50000″ g=”50000″ b=”50000″/>
Here is a typical lighting section for a 3D model or shape:
The first section is am3d:ambientLight that controls the ambient (background directionless) light. Set the color with am3d:clr and the intensity with am3d:illuminance. The illuminance n and d parameters represent the numerator and denominator of a ratio. So the default values of n=”500000″ d=”1000000″ are equivalent to 1/2 or 50% brightness.
After that, the are three point lights (am3d:ptLight). You don’t have to use all three. You can delete them from the XML, comment them out or use the enabled parameter to turn them off:
<am3d:ptLight rad="0" enabled="false">
The rad parameter sets the radius of the light. The units are EMUs (English Metric Units), where 1 inch has 914,400 EMUs and 1 centimeter equals 360,000 EMUs. Set this number in the millions to have a noticeable effect.
You can also add more point lights, but usually three is enough. The color and intensity parameters work the same way as the ambient light.
The other major parameters are for the position of the lights. The left-right position is set by the x number. 0 is dead center, positive numbers move the light to the right and negative numbers to the left. The y number controls the position up and down, while z controls the in-out third dimension. This line would place the light inside the model:
<am3d:pos x="0" y="0" z="0"/>
The pos units are also EMUs. Use tens of millions to notice the effect.
After making changes to the XML and re-opening the presentation with the model, the appearance will be the same as before you edited it. This is because PowerPoint displays a PNG of the model, created when you save. To display the revised lighting, you must make a small change to the model so PowerPoint updates the appearance.
Word Master Documents are a useful feature with a problem. The master document along with its subdocuments can easily get corrupted, sometimes losing the whole collection of Word files. Word professionals will normally advise you to steer clear of them, for this reason. Here’s how to create automated Word master documents that make this feature safe to use.
When you have a collection of Word files, perhaps from disparate sources, and you need to print them or save to PDF with a common table of contents, Master Documents are a good solution.
In my opinion, the real problem is that Master Documents are work to assemble. When you’ve put all the effort in to create one, it’s so tempting to keep it as a permanent collection. But over time, some of the subdocuments need to be revised. That’s when the heartbreak begins, because editing the subdocuments while they are part of a master document can easily corrupt part or all of the collection of files.
Automated Word Master Documents
I’ve created a Word template with a VBA macro that automates the creation of a master document from a folder full of Word files. If the master document is easy to create, then it’s easy to delete when you’re done printing. And that’s exactly what you should do: use the to create temporary master documents, print or save to PDF, then put the master file in the Trash. The folder of Word files that were the source of the subdocuments will be untouched and uncorrupted.
The next time you need to print, simply run the macro again. Create a new master, print it, delete it. This is the safe way to use this powerful Word feature.
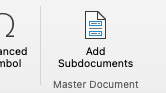
The template works with both Windows and macOS versions of Word. You can use the file as a standalone template for occasional use. Double-click on it to create a fresh Word file. Click on the Insert tab, then on the Insert Subdocuments icon at the right end of the ribbon. Choose the folder that contains your Word documents. After the subdocuments are added, add a table of contents, if you like. Print or save to PDF, then delete the automated Word master document.
You can also use the template as an Add-in. This is handy if you often create master documents. See the instructions that accompany the template to learn how to install it. Then, whenever you open Word, the Insert Subdocuments icon will appear at the right end of the Insert tab.
Installing as an Add-in has the advantage that you can easily use a preformatted Word file that already has a table of contents set up ahead of time. You can create, print and delete an automated Word master document in a matter of seconds.
Please note: You might ignore the instructions to delete the master document after printing. You might corrupt your files. Because of this potential problem, use this add-in at your own risk. We are not responsible for document corruption or data loss in your documents.
After 15 years, I got tired of waiting for Microsoft to provide Content Controls in Word for Mac. So I wrote a VBA add-in to do it. The Word for Mac Content Control Add-in is free if you subscribe to this blog. There’s no installer (Apple’s sandbox requirements for automatic installation are onerous.), but I provide installation instructions.
Content Controls are a superior way of creating forms, easier to create and use then the Legacy Form Fields that are built into Word for Mac. In a previous post, I’ve written about how you can insert content controls using VBA: Content Controls for macOS – Cool Code. But using VBA requires more technical ability than the average Word user has. So writing an add-in makes these controls available to a much wider group of users.
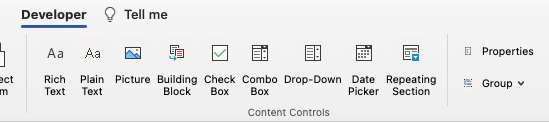
The new content controls appear on Word’s Developer tab:
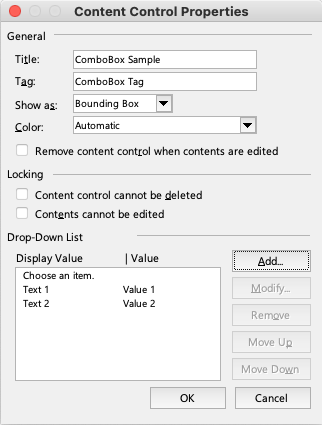
The Properties button opens a dialog that allows you to set the items relevant to that type of control:
Current issues with this Content Control add-in:
In Word for Windows, you can set a separate character style for the control. The VBA commands for sorting styles don’t do the same thing as the Word interface, so I haven’t been able to make this work the same as in Windows. Using my Content Control add-in, the content controls currently take on the style of the paragraph in which they are inserted, except for the Date Picker which displays Times New Roman (?!) when a date is selected.
The color for a control can be set to the same colors as in Windows, but there isn’t a custom color input yet.
If and when Microsoft gets around to adding content controls, the checkbox will probably select checked and unchecked characters from the macOS Emoji & Symbols dialog. Unfortunately, that dialog includes many system fonts that can’t be embedded in a file (this is a big problem with choosing bullets in PowerPoint, but that’s material for a different article). So I’ve created a subset of checked and unchecked symbols that can be used in checkboxes. These characters will work as expected and can be embedded in a template or document.
The properties dialog in the Content Control add-in can’t preview the checkbox characters, because there is no way for VBA to retrieve the symbols currently used by a checkbox.
The date picker should be able to use a world-wide variety of locales and calendar types. I haven’t been able to program the system calls to macOS to get this information yet. The date picker currently uses U.S. defaults for date formatting. Using Microsoft date formatting codes (dd-mm-yyyy, etc.), you should be able to set up dates for other languages based on a Latin (Western) script. This is one of the items that needs testing in other languages.
A known error occurs if you try to insert a Content Control into an old Word file in .doc format. You’ll see an error like Run-time error 445: Object doesn’t support this action. Update the file to .docx format to fix the issue.
A few users get error messages when trying to modify existing content controls. To date, we have not been able to reproduce, and thus solve, this bug. If you get an error, please post a comment including your processor info (Intel or Apple chip), macOS version and Office edition.
You can get a free copy of the add-in by subscribing to this blog. If you’re already a subscriber, please write to me at the email in the right-hand column, and I’ll send it to you. Please note, we do not send to disposable email addresses.
As Apple and Microsoft release new operating systems, it’s no longer possible to install the latest version of Office on your old computer. Here’s is a list of the most recent Office you can run for the operating system you have, plus where to find it.
Most Recent Office You Can Run on macOS (Updated for 2024)
Rant alert! Microsoft supports the last three operating systems in both Windows and Mac. Unfortunately, Apple has a policy of releasing a new operating system every year, whether we need it or not. The result of these two business decisions is that there are rafts of perfectly serviceable Macs out there that can no longer install the current version of Office. It looks like Apple intends us to toss them and buy new ones. Another case of lip service to environmental sustainability. Rant over
If you buy or subscribe to Office for Mac today, you’ll only find the current versions of Microsoft 365 (the subscription version) and Office 2024 (the retail edition) to be easily available. But Microsoft maintains a page of older installers at Update history for Office for Mac. All of them can be activated under a current Microsoft 365 subscription or Office 2024 license.
Please note that all of these are final releases: there will be no security updates to follow. Be careful when downloading Office files from the interweb.
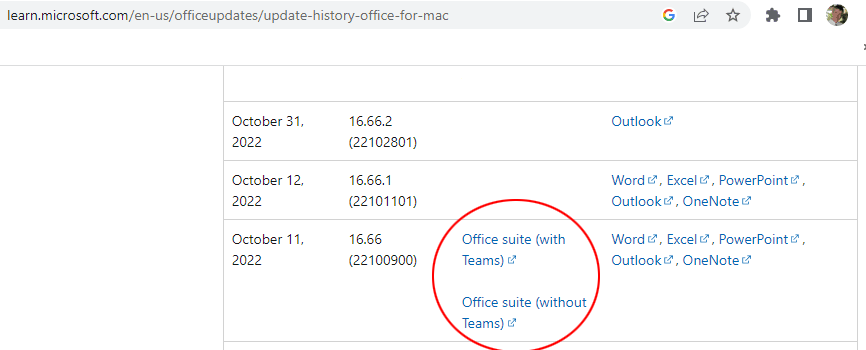
As of October 2024, the current crop of obsolete Macs are those that can only run Monterey (macOS 12). These are machines that are around 10 years old, but are completely useable for applications like Office. The last Office version that Monterey can run is 16.89.1. At the History page, look for the Office Suite Installer, with or without Teams, dated September 17, 2024. Do not download the updaters for individual programs! Download the Office Suite installer!
Then run the downloaded installer. After installing, normally Microsoft AutoUpdate fires up and installs the final 16.89.2 version for Outlook. Wait until it finishes, then open Applications and run one of the Office apps.
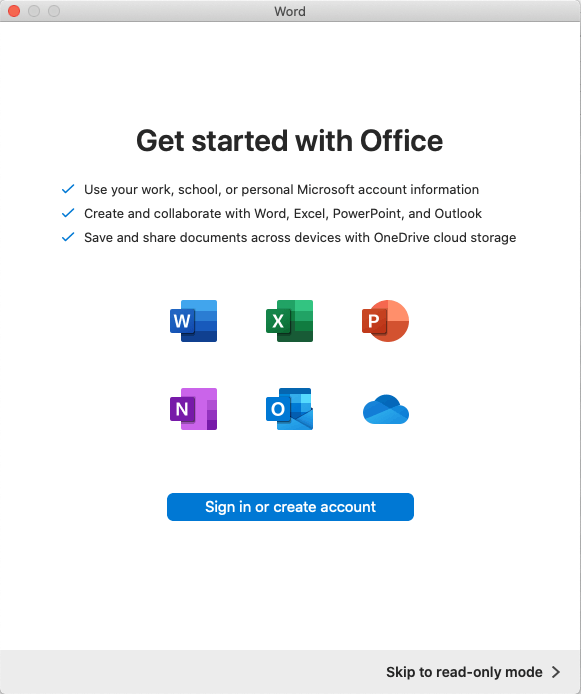
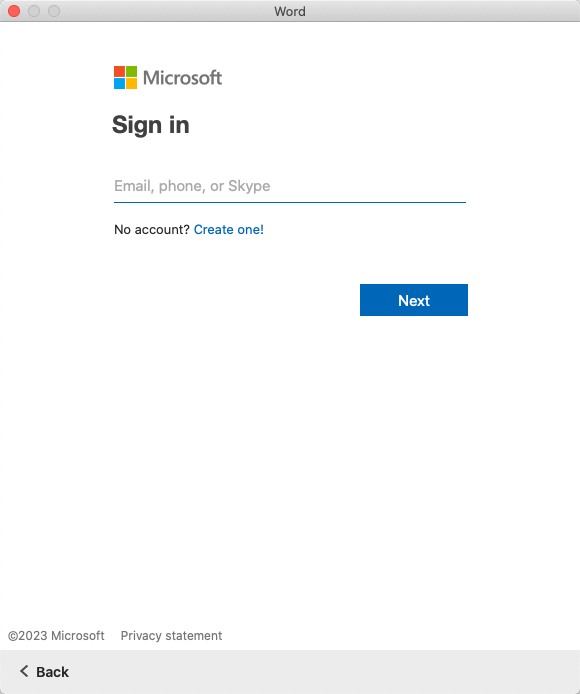
You’ll see a dialog prompting you to sign into your account. Enter your name and password.
If you’re a Microsoft 365 subscriber, that should be the end of the process. Your software will be activated and you’re good to go.
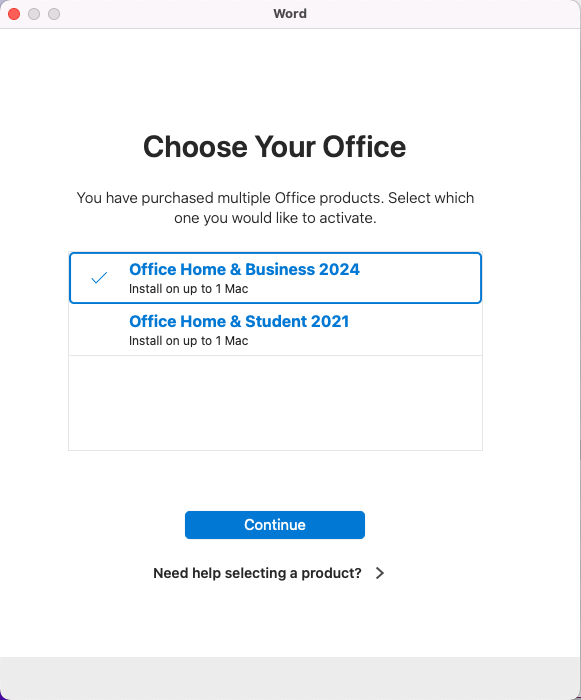
If you have purchased multiple permanent license editions, you’ll see a dialog asking to to choose which license to apply. Office 2019, 2021 and 2024 no longer have separate licenses for Mac and Windows, so at this point it possible to switch Office 2021 (for example) from Windows to macOS or vice versa.
Older Editions of macOS
Big Sur (macOS 11) can run Office 16.77. At the History page, look for the Office Suite Installer, with or without Teams, dated September 12, 2023. Reminder: Do not download the updaters for individual programs! Download the Office Suite installer!
Catalina (macOS 10.15) can run Office 16.66. At the History page, look for the Office Suite Installer, with or without Teams, dated October 11, 2022. Reminder: Do not download the updaters for individual programs! Download the Office Suite installer!
Catalina was the first OS to require 64-bit software. This requirement made Office 2011 obsolete, since it’s 32-bit. But Office 2011 is still a useful edition in macOS. It can still do things that were permanently removed from later versions of Office. So you might want to stick with Mojave and install the newer Office that goes with it. (There’s no problem in having Office 2011 and a later version installed on the same computer.) In this scenario, download and install the 16.54 version dated October 12, 2021.
One of my favorite Macs is my 17″ MacBook Pro. It’s the machine that travels with me, but it’s 12 years old and can run only High Sierra. The most recent Office you can run on this computer is 16.43, dated November 10, 2020.
There’s a pattern here: Apple releases new operating systems in the fall, usually in September or October. The Office version that Microsoft releases the same month is the last one for the fourth-oldest macOS. I don’t have any machines running Sierra, but if I did, I would try the October 15, 2019 edition of Office 16.30.
As I mentioned earlier, you can run an older version of Office on an older computer. Since Office 2008, the file format has remained pretty constant, so the software can still be useful. You can install Office 2011 under Mojave or earlier, while Office 2008 can be installed under El Capitan and earlier. These versions can co-exist on a Mac with a newer version (or with each other), though Microsoft’s History page only goes back to 16.27 from July, 2019.
Updating macOS on Older Machines
As an alternative to instaling an old version of Office, you might consider updating macOS. Here at Brandwares we’re testing Open Core Legacy Patcher. This open-source project allows new versions of macOS to run on old Macs that Apple no longer supports. So far, the results are quite encouraging and we haven’t seen many problems. Our suggestion is to install the next-to-newest version, as each new edition of macOS causes issues that take time for the Open Core project contributors to patch. As an example, at the time of writing, Sequoia has been released, but we installed Sonoma on our test machines. This has allowed us to update these computers to the current version of Office.
Most Recent Office You Can Run on Windows
Under Windows, the situation is easier, as Microsoft waits about 3 years between operating systems. Plus Windows isn’t as finicky about the hardware it runs on. I have an old Mac Pro from 2006 that can only run OS X Lion and Office 2011, but under Boot Camp it does either Windows Vista and Office 2010, or Windows 7 and Office 2016. Windows 8 is likewise limited to Office 2016, while Windows 10 (now 9 years old!) can run the current version of Office 2021 and Microsoft 365. You have to have a really old Windows computer to be unable to run a useable copy of Office.
Years ago, Ken Puls of the excellent Excelguru site published an Excel add-in that displays the icons built into Excel. This reference is useful for any programmer wanting to repurpose built-in icons to use with their own code. Here’s where you can download the original: Office 2007 Icon Gallery. His version has gradually become outdated as Microsoft has added more icons to the software, and there was no version for PowerPoint. The latter isn’t such a big deal, because Excel, Word and PowerPoint share a common library of icons.
With Ken’s gracious permission, I’ve created an updated PowerPoint version of this add-in. This displays all the icons in current versions of Office, and it runs under PowerPoint for Windows and for Mac.
This is version 2. If you downloaded this prior to January 24, 2023, please download and install this improved version. I haven’t created an installer for this, but here are the instructions for manual installation:
The download is a zip file that holds a single Icon Gallery.ppam file. Expand the zip and copy the .ppam file to your desktop or other easy-to-find location. Here’s how to make it appear in PowerPoint for Windows:
In PowerPoint, choose File>Options>Add-ins.
Change the Manage dropdown to PowerPoint Add-ins, then click on the Go button. The Add-ins dialog opens.
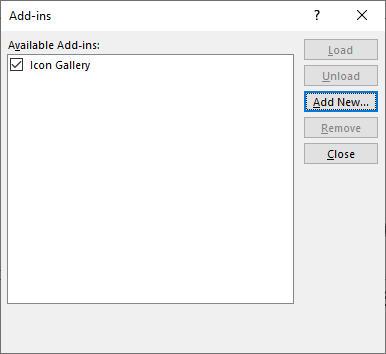
Click on the Add New button. Navigate to the location where you saved the .ppam file, select it and click on OK. The Add-ins dialog should look like this, displaying the add-in name with a check mark beside it:
Click on the Close button.
In PowerPoint, select the View tab. At the right end, you should see a new group called Office Icons:
macOS Installation
In PowerPoint, choose Tools>PowerPoint Add-ins from the macOS menu bar. The Add-ins dialog opens.
Click on the Plus (+) sign. Navigate to the location where you saved the .ppam file, select it and click on OK.
PowerPoint will pop up a macro warning. Click on the Enable Macros button.
Then PowerPoint will pop up this dialog, astoundingly badly worded, even for Microsoft: It sounds like you’re turning off macro protection completely, right? Well you’re not. This just turns it off for this file, and it has no effect on the macro virus protection settings, so there’s nothing to even turn on again! Click on Turn Off.
The Add-ins dialog should look like this, displaying the add-in name with a check mark beside it:
Click on the OK button.
In PowerPoint, select the View tab. At the right end, you should see a new group called Office Icons:
Using the PowerPoint Icon Gallery
Windows Useage
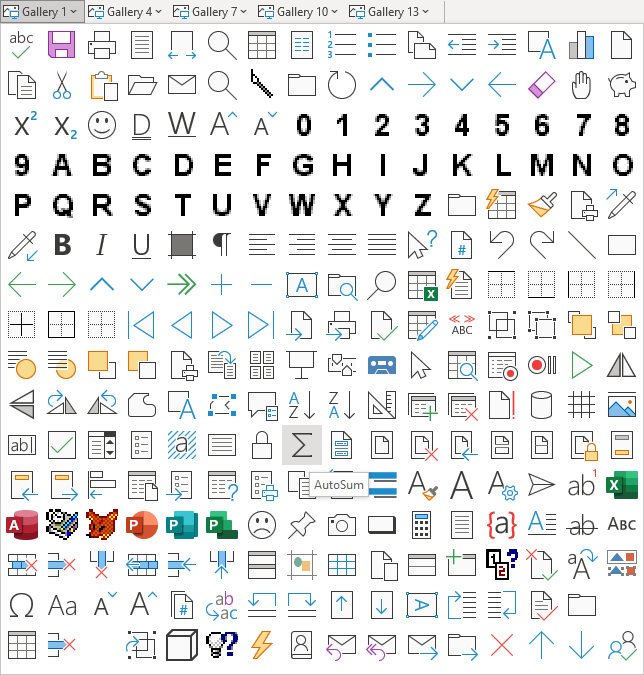
Click on one of the galleries to see a group of icons. Here are the first 256:
Hover over an icon to see its idMso command name.
Click on an icon to open a dialog that shows the command name for use with idMso or imageMso commands. Click on the Copy to Clipboard button to copy the command name. Then paste the name into your XML or other code. Due to a bug in File Explorer, all Explorer windows must be closed for this to work as expected.
macOS Useage
Click on one of the galleries to see a group of icons: Note the grey spinning icons: Those are objects that exist in the Windows version, but not in macOS. One of the drawbacks of trying to develop for both platforms is that Microsoft has only done half the job in Office for Mac. Avoid these icons for cross-platform macros.
Hover over an icon to see its idMso command name.
Click on an icon to open a dialog that shows the command name for use with idMso or imageMso commands. Click on the Copy to Clipboard button to copy the command name. Then paste the name into your XML or other code.
Uninstalling the PowerPoint Icon Gallery
Windows Uninstall
In PowerPoint, choose File>Options>Add-ins.
Change the Manage dropdown to PowerPoint Add-ins, then click on Go.
Select the add-in, then click on the Remove button. Close the dialog. The icon gallery disappears from the View tab.
macOS Uninstall
In PowerPoint, choose Tools>PowerPoint Add-ins (on the macOS menu bar).
Select the add-in, then click on the Minus sign (-). Close the dialog. The icon gallery disappears from the View tab.
Notes
Wouldn’t it make more sense to have this on the Developer tab? Well, yes, it would, that’s where the Icon Gallery appears in Ken Puls’ original add-in. But I made one file to work on both Windows and macOS. PowerPoint for macOS is missing the Developer tab. So I put this on the View tab as a second-best location.
Why no icon preview, as in Ken’s original add-in? Previewing icons in VBA relies on the CommandBars.GetImageMso command. This has been deprecated and in recent versions of Office, does not deliver an accurate icon preview. The command is not available at all on Macs, so I removed the preview. But you can see the 32 x 32 version of the icon in the gallery dropdown, not much has been lost.
Chart Templates allow you to capture and reproduce the appearance of sample charts. This avoids having to include sample charts for users to copy and paste. Here’s how to use them:
Installing
Chart templates must installed to a particular folder so Office can find them.
Windows Installation
Open a File Explorer window.
In the address field, paste in: %appdata%\Microsoft\Templates.
If there isn’t a Charts folder there, create one.
Copy the chart template(s) into it.
macOS Installation
While holding down the Option key, click on the macOS menu bar. Choose Go, then Library. The hidden user Library folder opens.
Open ~/Library/Group Containers/UBF8T346G9.Office/User Content/Chart Templates.
Copy the chart template(s) into it.
Using Chart Templates
Chart templates can be used in Word, Excel and PowerPoint. Here’s how to access them:
Windows Usage
In the Office program, choose Insert>Chart.
In the Insert Chart dialog, click on the Templates icon.
Select the chart template in the right-hand pane, then click on OK. A chart is inserted in your document.
macOS Usage
On the Insert tab, choose Charts>Templates and select the template from the pop-up list. A chart is inserted in your document.
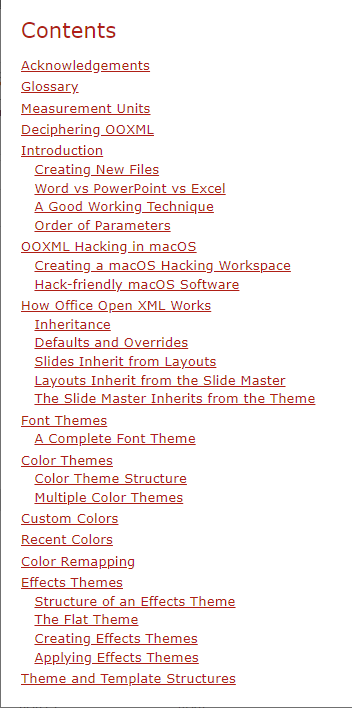
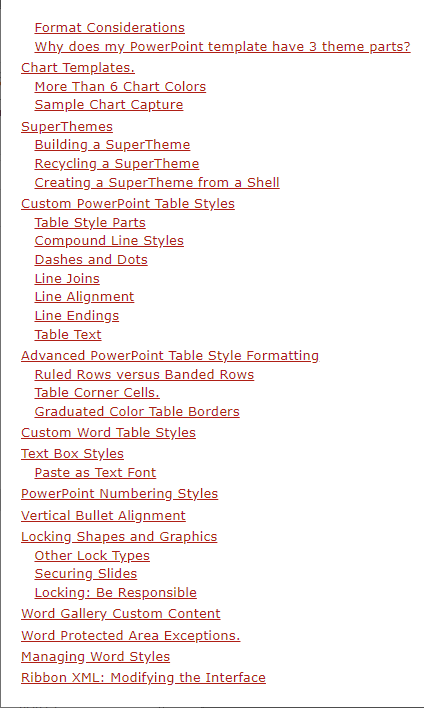
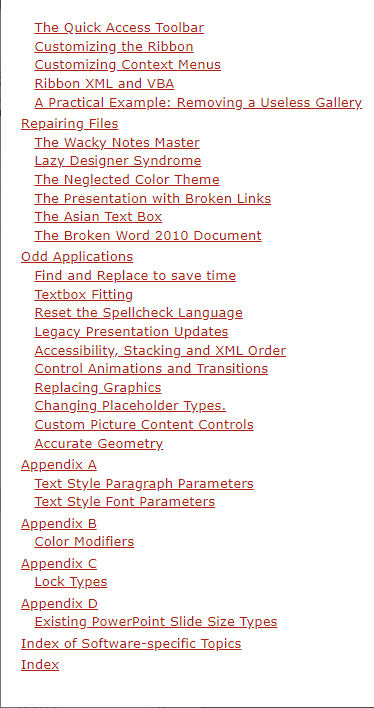
The ebook version of OOXML Hacking has been released. The last three years have gone into adding the equivalent of 40 pages of new information. This is in addition to the trove of unique techniques that already appeared in the print version. Here are screen shots of the table of contents, to give you an idea of the topics covered in this publication:
Barnes & Noble distributes only in the U.S., so use Kobo.com if you’re from another country.
As always, all techniques are covered in both Windows and Mac, where possible. The book contains a link to a downloadable text file of all listings in the book, so you don’t have to re-key text from the screen. The book is currently available on Kobo.com and Barnes & Noble. Barnes & Noble distributes only in the U.S., so use Kobo.com if you’re from another country.
Please note, this e-book has digital rights management applied. All code listings are available in a downloadable text file, so you don’t have to re-key anything. If you have any problems, please contact us at this address